
Figure 9.
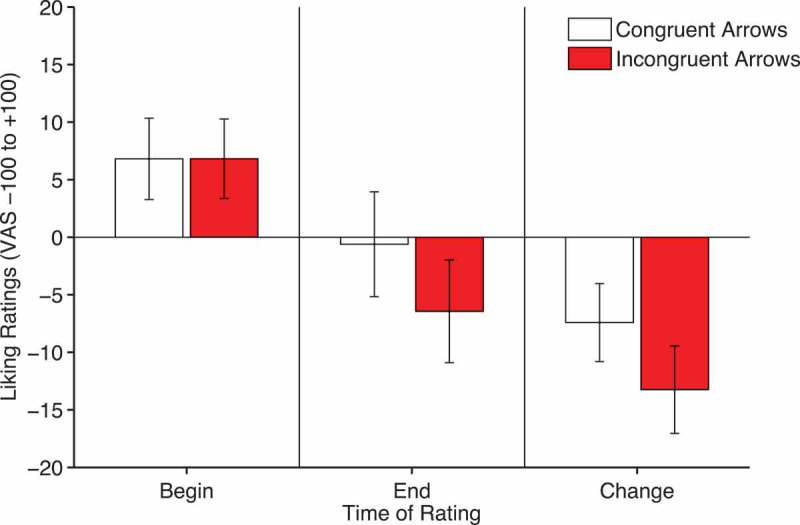
Liking ratings of congruent and incongruent arrows before (left panel) and after (middle panel) cueing and the change in ratings computed by subtracting beginning from end ratings (right panel). Error bars show +/-1 standard error of the mean.