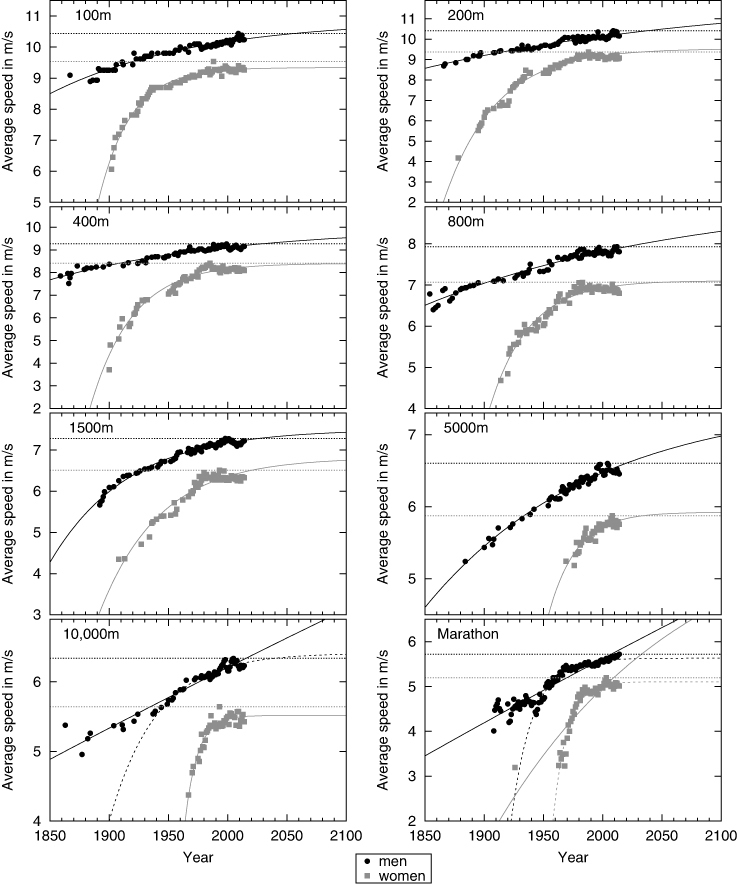
Figure 1. Exponential time series analysis of the women's and men's season-best sprint and distance running performances; axes are scaled linearly; solid lines represent the best fit to the data according to equation 1; dashed lines for the 10,000 m and marathon events represent the best fit for performances established after 1945; dotted horizontal lines represent the current world record (Data sources: IAAF, 2011, 2012, 2015).

