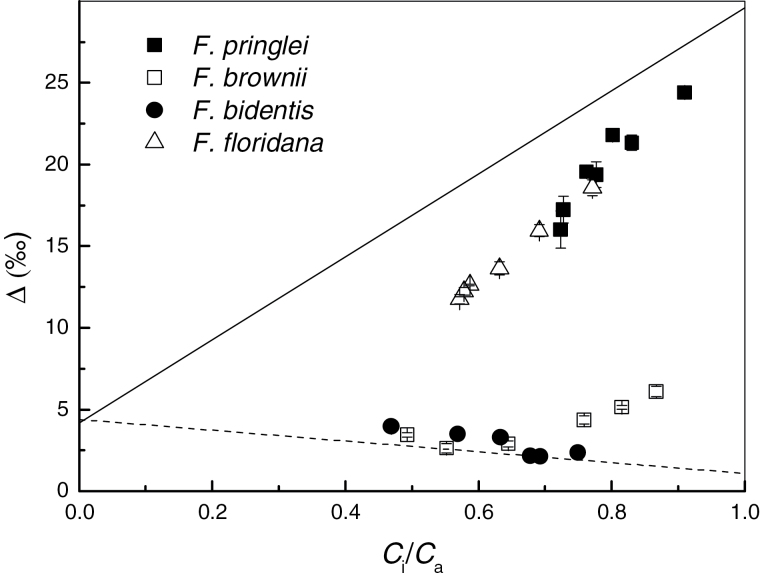
Fig. 4.
Observed carbon isotope discrimination, Δ expressed as a function of the ratio of intercellular to ambient CO2, C i/C a, in F. pringlei, F. floridana, F. brownii and F. bidentis. Values are the same as plotted in Fig. 3. Solid line represents the theoretical response of Δ to C i/C a in C3 plants ( ; (Roeske and O’Leary, 1984; Evans et al., 1994). Dashed line represents the theoretical response of Δ to C i/C a in C4 plants, (Henderson et al., 1992) when φ=0.25.

