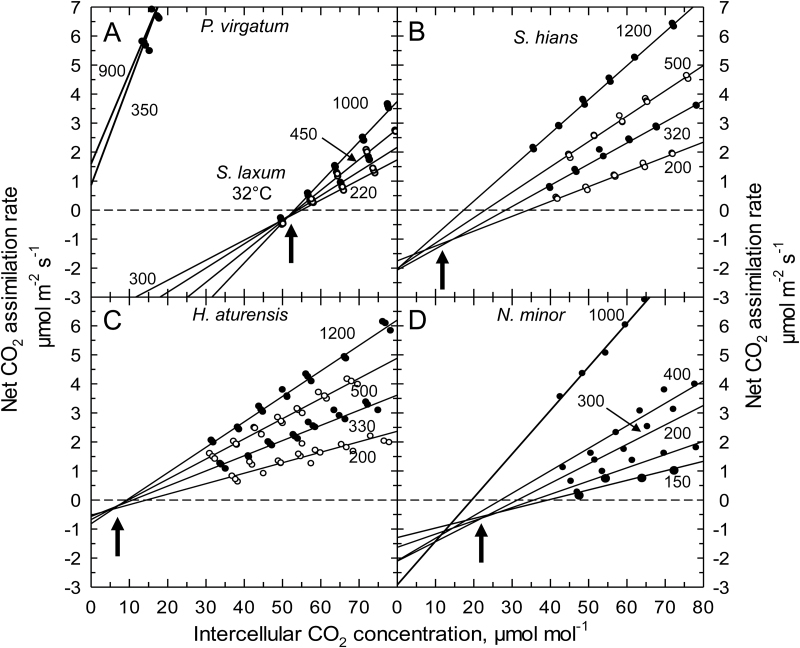
Fig. 5.
Representative A/C i responses below 80 µmol mol−1 determined on single leaves at four distinct light intensities of (A) Panicum virgatum (C4) and Steinchisma laxum (C3 proto-Kranz), (B) the C2 species Steinchisma hians, (C) the C2 species Homolepis aturensis, and (D) the C2 species Neurachne minor. Measurement light intensities are indicated beside each curve in µmol photons m−1 s−1. The C* estimate is indicated by arrows. Curves shown are representative of 3–6 measurement sets per species, except for P. virgatum where two sets of measurements were obtained. Measurement temperature was 31±1 °C.

