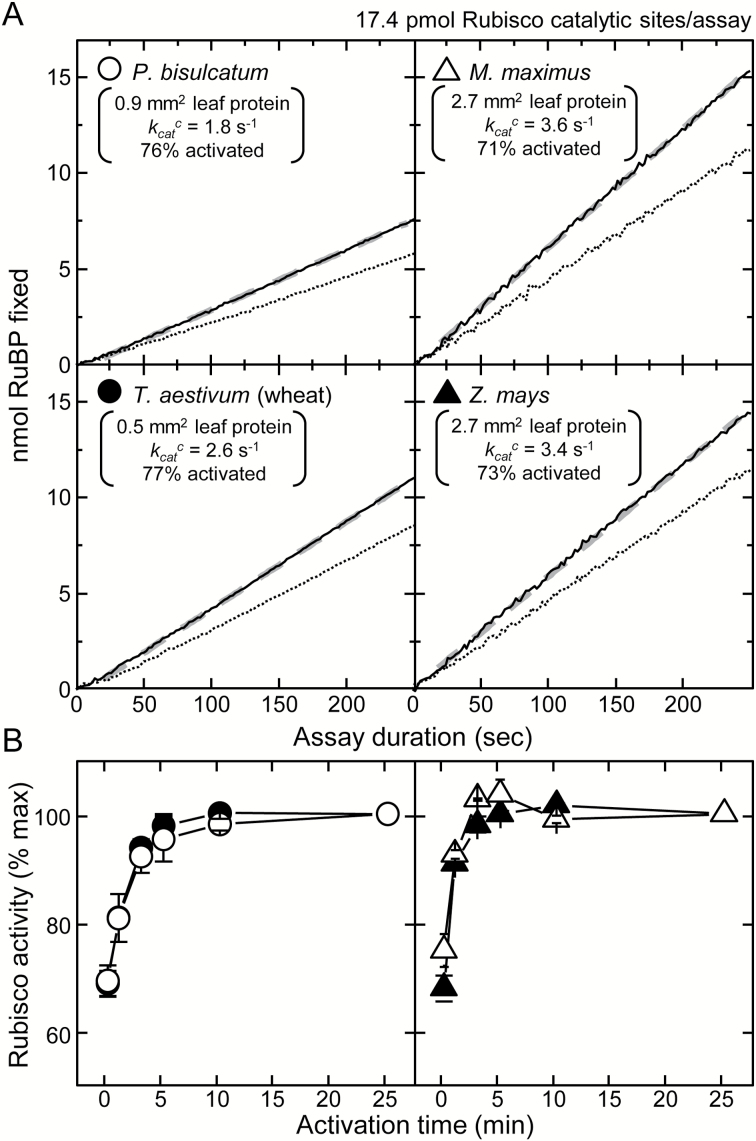
Fig. 4.
Variations in Rubisco content and activation status during leaf ontogeny can account for variations in the in vivo estimates of V c max. (A) Representative NADH-linked assay data showing the linear RuBP carboxylation rates in assays of initial (dashed lines) and total (solid lines, after 10–15min activation) Rubsico activities at 25 °C using soluble leaf protein from both C3 (P. bisulcatum, T. aestivum) and C4 (M. maximus, Z. mays) monocotyledon species. Shown are details of the calculated Rubisco activation status (% of maximum), the derived carboxylation rates (k cat c, quantified from the slope of the fitted linear regression, gray dashed line, divided by Rubisco content quantified by [14C]CABP binding) and the area of leaf protein required to attain the 17.4 pmol Rubsico catalytic sites used to normalize the plotted data to highlight the variations in k cat c between each species (see also Table 1). (B) Response of Rubisco activation and activity in the soluble leaf protein of each species following incubation at 25 °C. Shown is the average (±SE) of analyses from three separate leaf samples for each species expressed as a percentage of the maximum activities measured after 25min activation.

