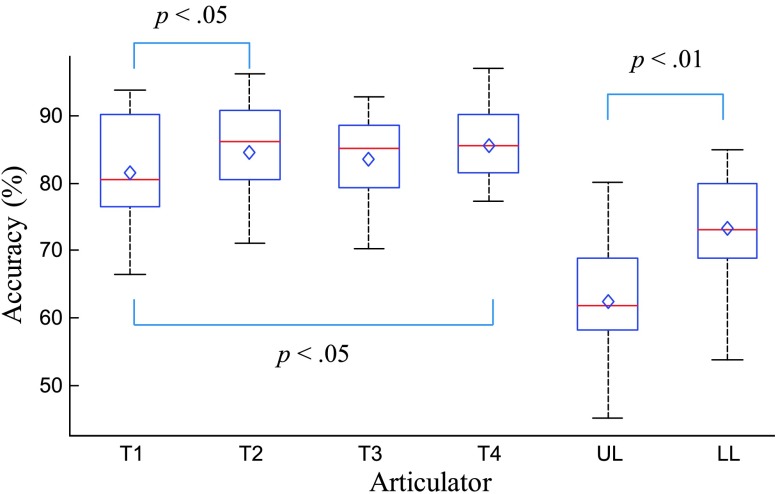
Figure 3.
Average vowel-classification accuracies across participants for individual sensors, shown as box-whisker plots (diamond is the mean value; red line is the median; edges of the boxes are 25th and 75th percentiles). There is a significant difference between any tongue sensor and any lip sensor (not displayed).

