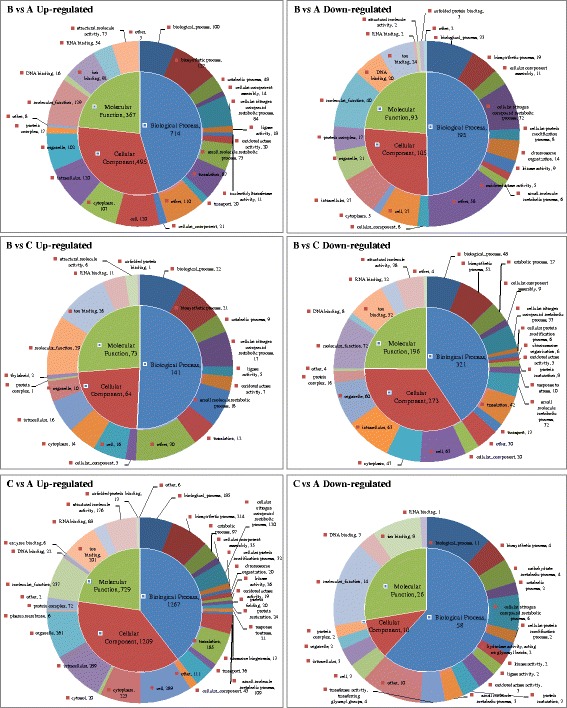
Fig. 3.

Gene ontology (GO) enrichment analysis of the differently expressed genes in pairwise comparison groups B vs A, B vs C and C vs A. A: untreated blank control, B: treated for 24 h at 12 °C, and C: developed for 24 h at 25 °C

Gene ontology (GO) enrichment analysis of the differently expressed genes in pairwise comparison groups B vs A, B vs C and C vs A. A: untreated blank control, B: treated for 24 h at 12 °C, and C: developed for 24 h at 25 °C