Fig. 6.

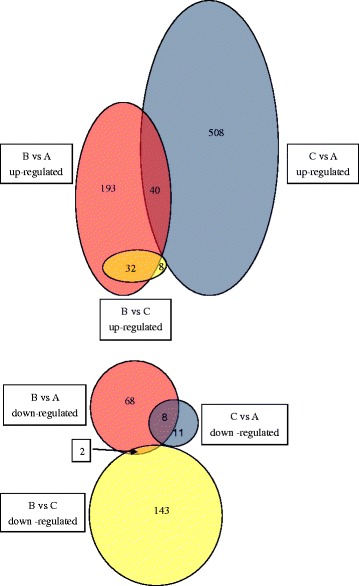
Pairwise comparisons of differentially expressed genes in pairwise comparison groups B vs A, B vs C and C vs A. The red, blue, and yellow circles indicate DEGs in groups B vs A, C vs A and B vs C, respectively

Pairwise comparisons of differentially expressed genes in pairwise comparison groups B vs A, B vs C and C vs A. The red, blue, and yellow circles indicate DEGs in groups B vs A, C vs A and B vs C, respectively