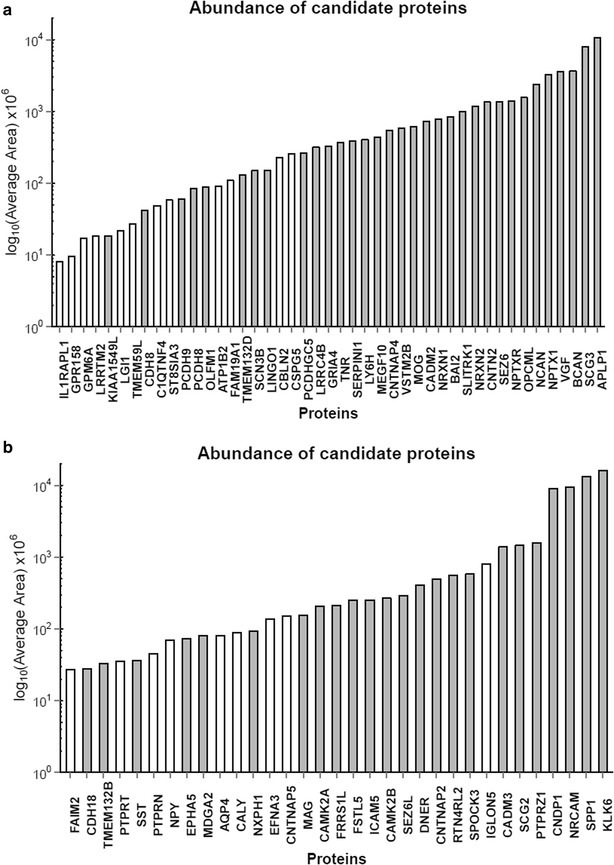
Fig. 4.

CSF brain tissue-enriched and group-enriched proteins and their relative abundance. a 45 brain-enriched and b 33 group-enriched proteins were detected in at least 4 out of 6 CSFs samples, and the average MS1 area was used as a proxy of protein abundance. Abundance is indicated for representative protein isoform. Shaded bars show proteins that are detected in all 6 samples
