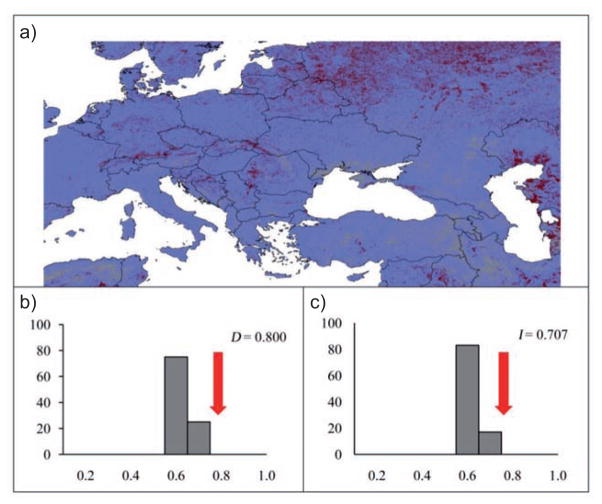
Fig. 2.
(a) Difference between suitability predicted for wild birds and poultry, based on remotely sensed environmental data. Grey indicates agreed prediction between models, white indicates areas predicted by poultry but not wild bird, and black indicates the reverse. (b) Histograms illustrating measured overlap (arrow) and distribution of background similarity among random replicate models for D, and (c) I metrics, for the wild bird remotely sensed model.

