
FIGURE 4.
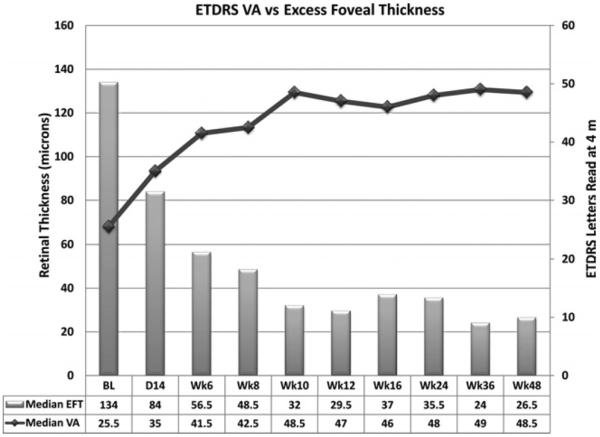
Visual acuity (VA) and excess foveal thickness and subretinal fluid between baseline and the primary endpoint at 24 weeks. Median VA in number of letters read on an ETDRS chart at 4 meters is shown by the line graph. The median VA at baseline was 25.5 letters compared with 48 letters at the primary endpoint, a gain of 23 letters. The median change in excess foveal thickness (EFT)/subretinal fluid (SRF), which is the thickness of the fovea combined with the height of SRF in the fovea – 212 μm, is an indication of the amount of excess fluid within and under the retina is shown by the bar at each time point. The excess fluid present at baseline was reduced by 72%.