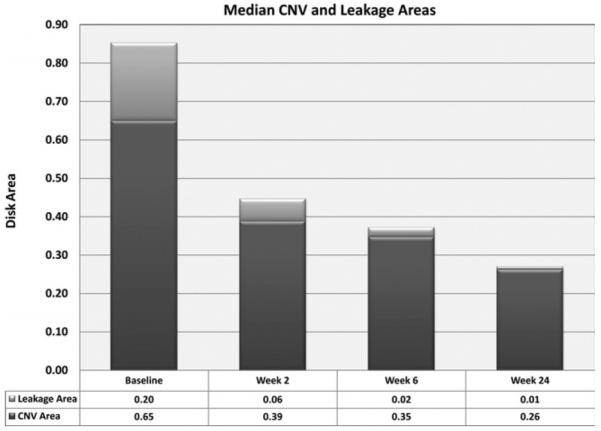
FIGURE 5.

Median area of CNV and area of leakage at baseline and three time points after start of bevacizumab infusions. Each bar represents the median area of CNV (dark gray) and the median leakage area (light gray) calculated as described in the Methods section from measurements made on FAs obtained in nine patients at four time points. There is a sequential decrease in both parameters (total lesion size) at weeks 2 and 6.
