
Fig 2. Effects of Cyp1b1 deletion on liver gene expression in relation to diet.
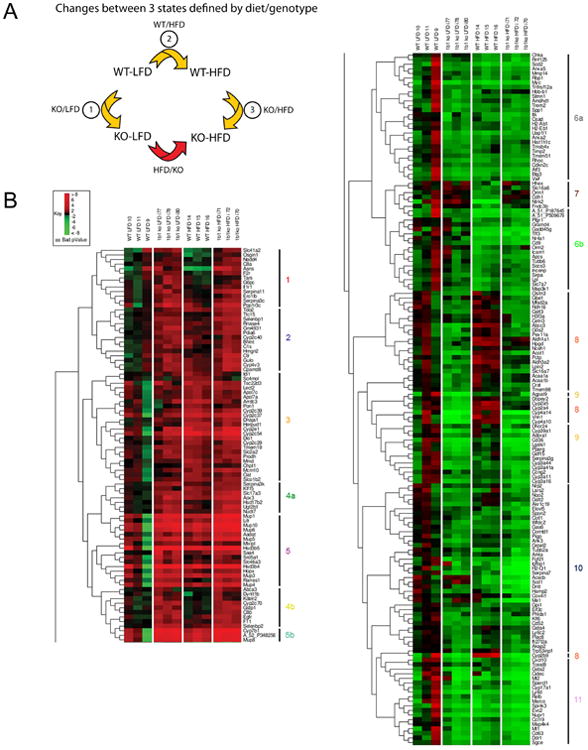
(A) Presentation of gene responses as three distinct ratios representing the interactions of Cyp1b1-ko (KO versus WT) and diet effects (HFD versus LFD). (B) Hierarchical clustering of gene responses (Cy5>2000, FC>2.0) with respect to presence or absence of Cyp1b1 on either the HFD or LFD. Vertical lines designate 11 clusters (Clusters 4, 5, 6, 8, and 9 were subdivided. Genes in each cluster are listed in Table S1).