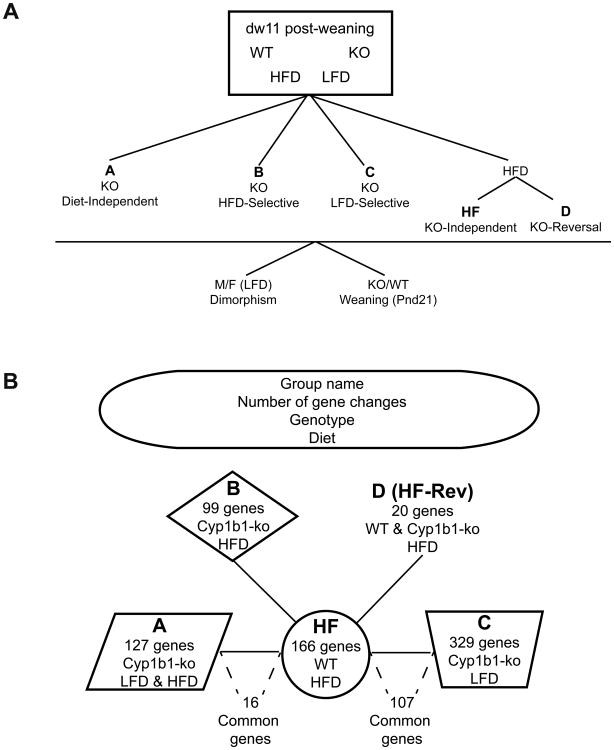
Fig. 3. Liver Gene expression changes for selected genes across four treatment combinations.
(A) Scheme depicting Cyp1b1-ko diet sensitive and insensitive designations for Groups A, B, C, D and HF. (B) Division of genes between 5 groups based on diet and Cyp1b1 selectivity. HF genes do not respond to Cyp1b1 deletion. Overlap between HF and groups A and C correspond to genes within these groups that show significant HFD/LFD changes in addition to the Cyp1b1 response.

