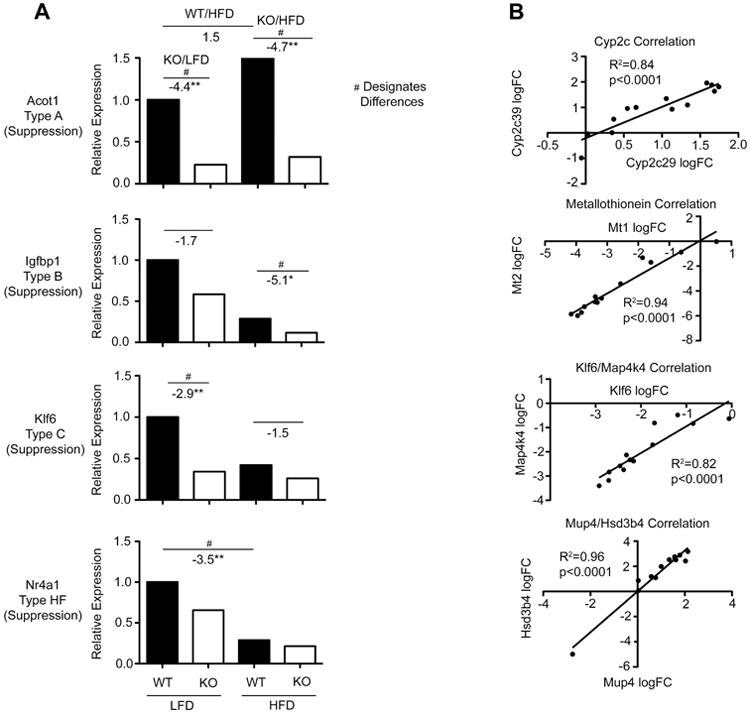
Fig 4. Genes representative of Cyp1b1 response Groups: Expression correlations for pairs of gene in individual mice.

(A) Relative expression levels for each of four treatments combinations for genes typical of Group A (Acot1), B (Igfbp1), C (Klf6) and HF (Nr4a1). (B) Expression of pairs of related genes in same family and different families correlated for the 12 individual mice across the 4 treatment combinations: Cyp2c29/Cyp2c39; Mt1/Mt2; Klf6/Mapk4k4; Hsd3b4/Mup4.
