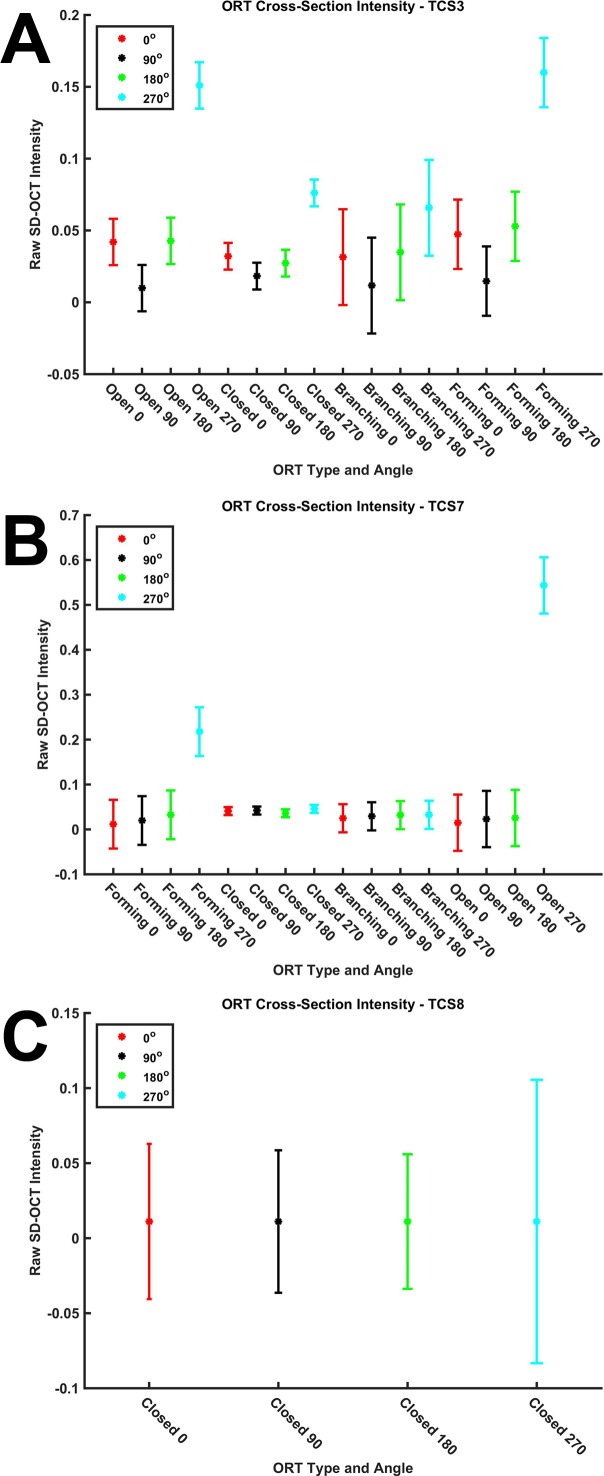
Figure 5.
Variation in hyperreflective outer retinal tubulation band in cross-section. From ORT cross-sections (examples in Figure 2), hyperreflective ORT band intensity was sampled. Average raw (linear) SD-OCT intensity (ranging from 0–1 in a 32-bit image) of intensity representing hyperreflective ORT band for each ORT type and angle in an SD-OCT volume. Representative examples of mixed intensity results (A), only 270° as significant (B), and no significant differences between angles (C). Error bars: 95% confidence interval for comparison between groups within an SD-OCT volume.

