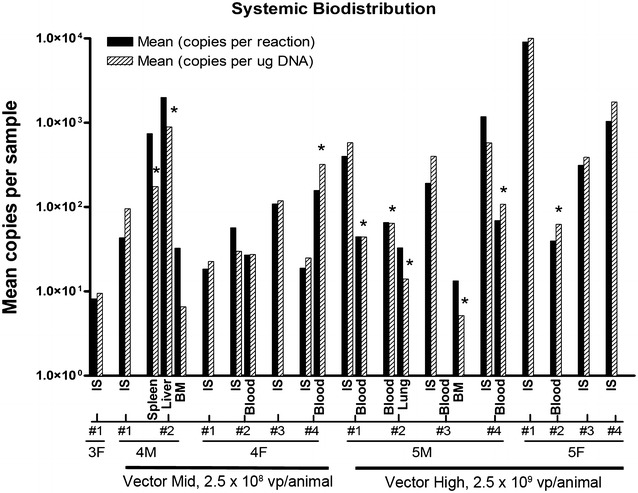
Fig. 4.

Biodistribution of vector DNA. Quantitative PCR values for mean copies per reaction and mean copies per μg of DNA for systemic organs and tissues at day 6 after vector administration. Tissues listed are those positive for viral DNA in each animal. Animals are delineated by group number and gender. The analyzed measurements are shown as mean copies per sample in the log10 scale. Each plot represents the average of duplicate samples and standard deviations are indicated by error bars. One-way ANOVA and Kruskal–Wallis test were used for comparison between viral copies in different organs/blood and those present at the injection site. *P < 0.05. G4 Vector mid 2.5 × 10⁸ vp/animal, G5 vector high 2.5 × 10⁹ vp/animal, IS injection site, BM bone marrow
