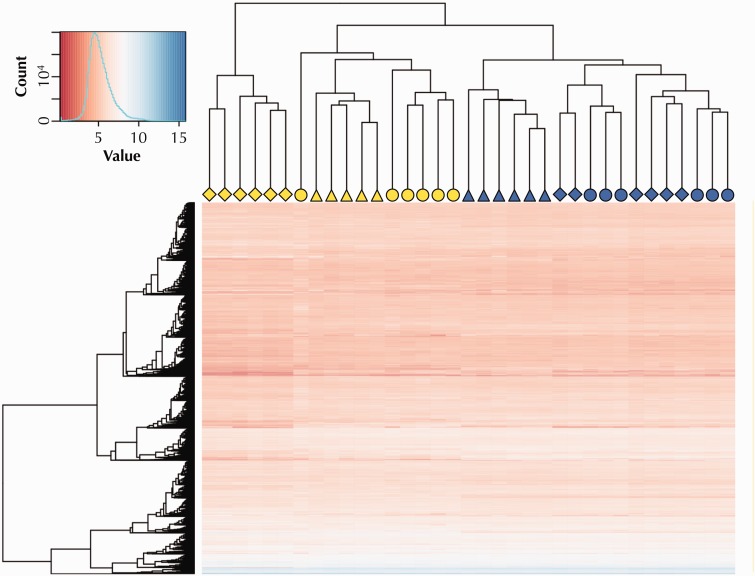
Fig. 2.
Results of a hierarchical cluster analysis and heat map showing expression variation in the 10,000 top expressed genes. Symbol shapes designate the population of origin for each individual in the analysis (○: Tacotalpa drainage; ▵: Puyacatengo drainage; ⋄: Pichucalco drainage). Yellow symbols represent individuals from sulfide springs, blue symbols those from nonsulfidic reference habitats.

