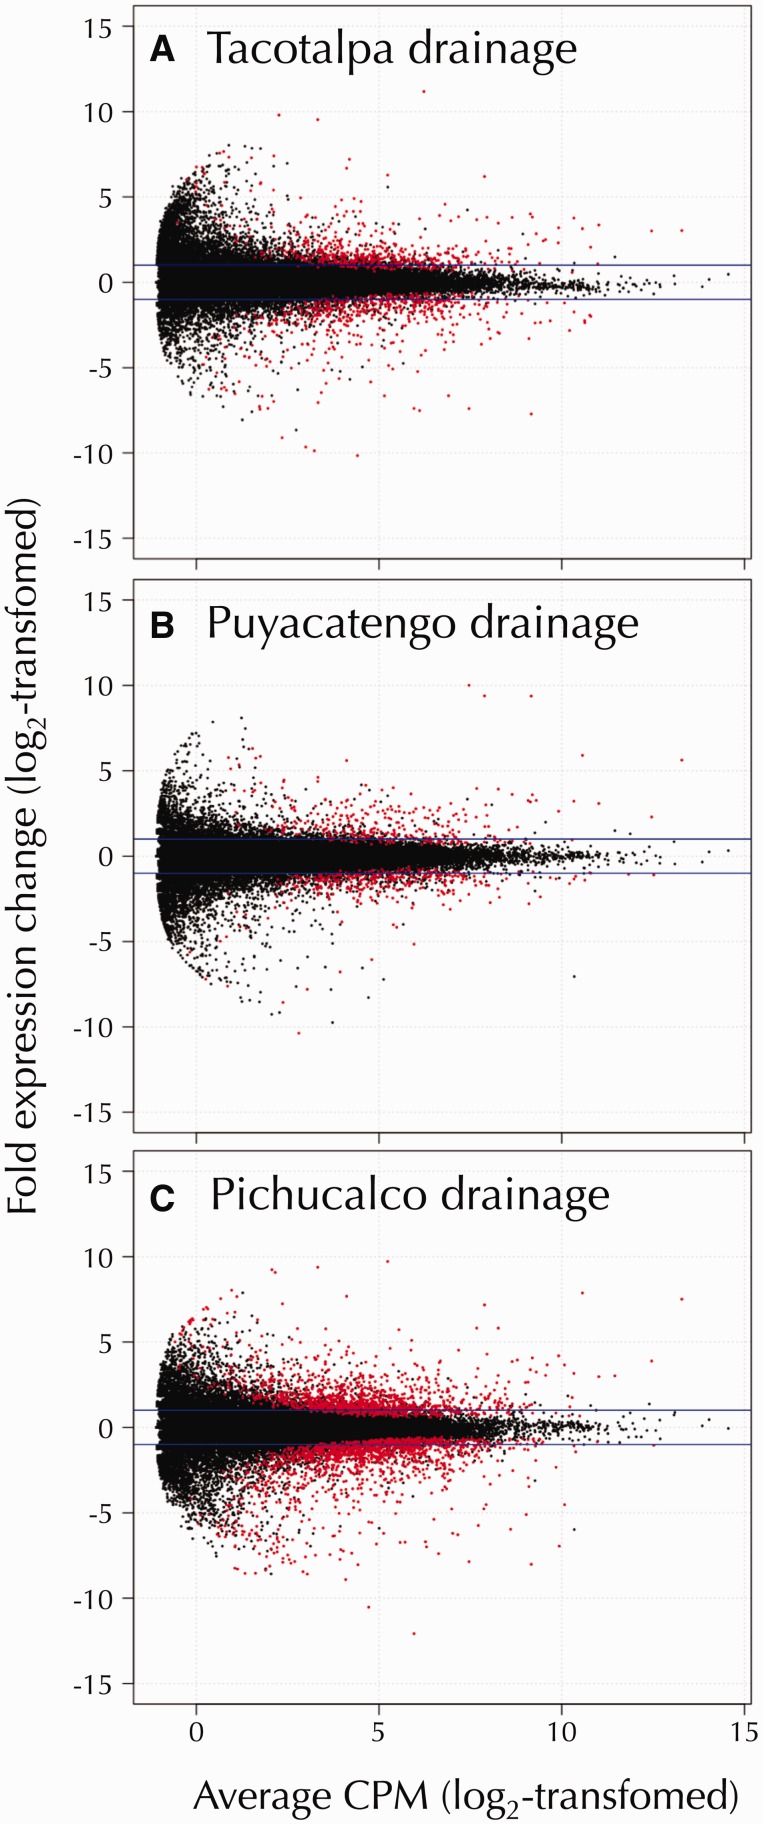
Fig. 4.
Volcano plots depicting the fold change in gene expression (log2-transformed) between the sulfidic and nonsulfidic populations as a function of the concentration of each transcript (in counts per million [CPM], log2-transformed). Transcripts with evidence for significant differential expression (FDR ≤ 0.001) are colored in red. The horizontal blue lines indicate a 4-fold difference in transcript abundance. Results are shown separately for the Tacotalpa (A), Puyacatengo (B), and Pichucalco (C) river drainages each of the river drainages investigated (panels A–C).

