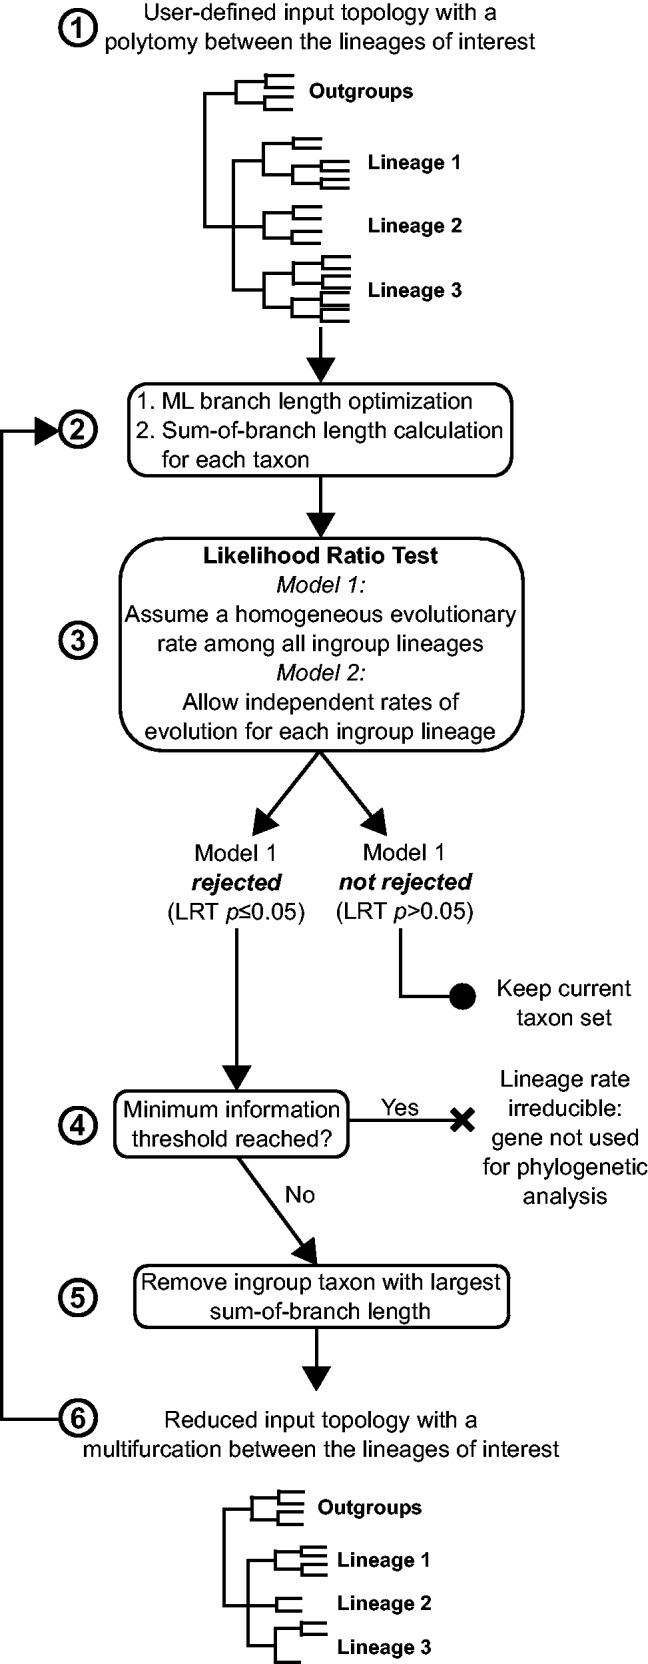
Fig. 2.

Flow chart representation of the LS³ algorithm. The input tree with the gene sequence alignment passes through a ML branch optimization step. The input tree contains a multifurcation that consists of the three lineages of interest (Lineage 1, Lineage 2, and Lineage 3). The sum of branch lengths for each ingroup taxon is calculated based on this tree (steps 1 and 2). Next, an LRT is performed between a model that assumes homogeneous evolutionary rates among ingroup lineages and a model that allows for a local rate of evolution for each of the three lineages (step 3). If the homogeneous evolutionary rate model is accepted for a set of taxon sequences, these sequences are maintained for further analysis. If the homogeneous evolutionary rate model is rejected, the fastest-evolving sequence is flagged and removed and the LRT test is repeated (steps 4–6). A minimum taxon sequence threshold is defined, and after reaching this threshold, sequences cannot be removed (in this study, this threshold is defined as only two species remaining per lineage, step 5). If a gene dataset reaches this threshold and the homogeneous model is rejected, the gene is flagged as unfit for phylogenetic analysis and can be removed by the user.
