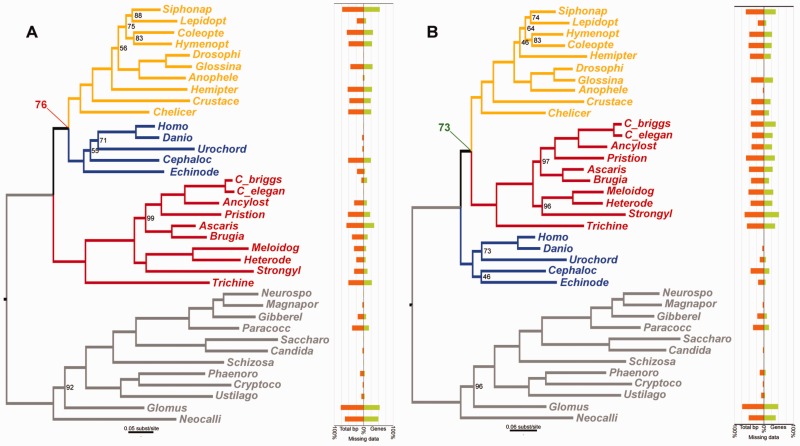
Fig. 4.
ML phylogenies and missing data plots obtained for the 35,371 amino acid alignments from Philippe et al. (2005b) before (A) and after (B) removing the sequences and genes flagged by the LS³ algorithm. Nematoda is colored in red, Deuterostomia is in blue, and Arthropoda is in yellow. When the full dataset is analyzed, Ecdysozoa (arthropods and nematodes) is not recovered, and an incorrect “coelomate” clade is produced with substantial bootstrap support (support value in red). However, the dataset without the LS³-flagged data recovers Ecdysozoa with relatively high bootstrap support (support value in green). The missing data plots show the percent of total missing data by species (orange) and the percent of genes in which the species was not represented in the dataset (green). Only bootstrap support values <100 are shown.

