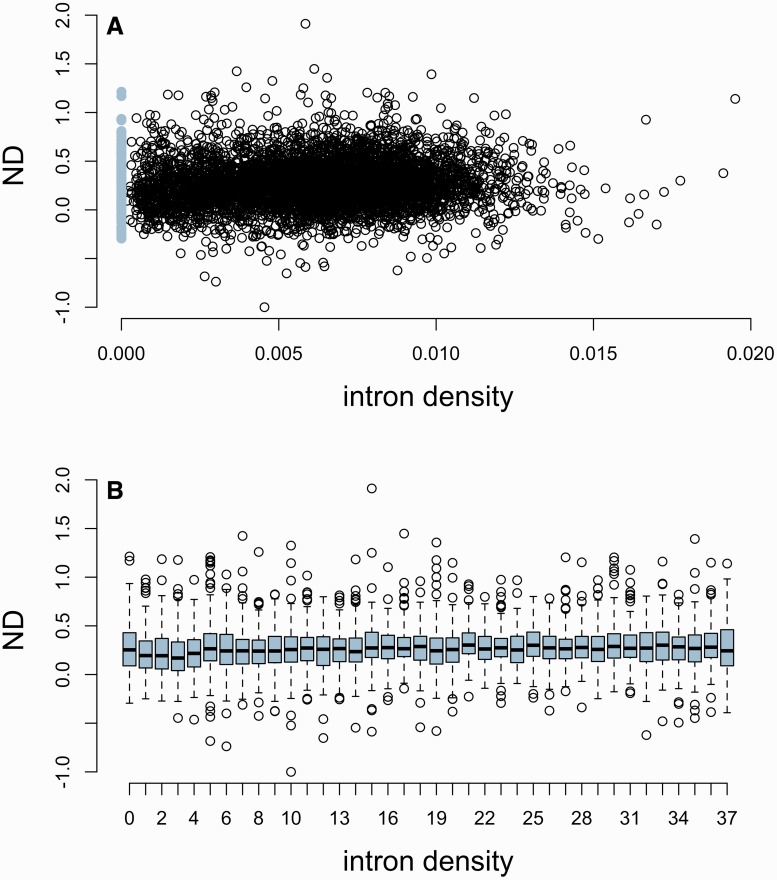
Fig. 4.
(A) Normalized ESE density (ND) in genes with differing intron density. Intronless genes have been highlighted in light blue. (B) Normalized ESE density (ND) in genes binned according to intron density. Intronless genes correspond to the first bin. The number of bins was chosen to obtain roughly the same number of genes in each intron-containing bin as in the intronless one.

