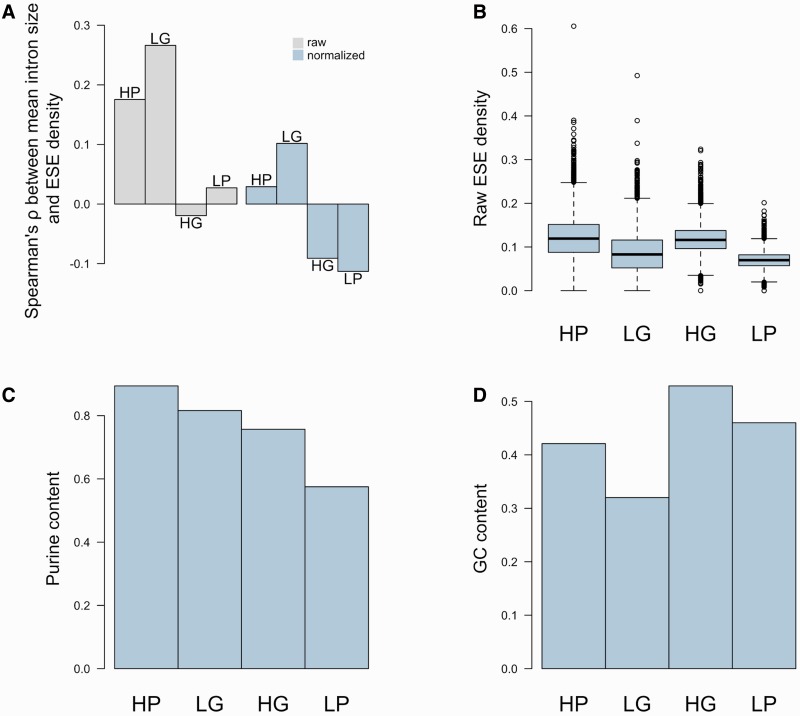
Fig. 5.
(A) Spearman rank correlation coefficient between raw ESE density (grey bars) or normalized ESE density (ND) (blue bars), and mean intron size calculated using different sets of ESEs. (B) Raw densities of different subsets of ESEs. (C) Purine content in the different sets of ESEs. (D) GC content in the different sets of ESEs.

