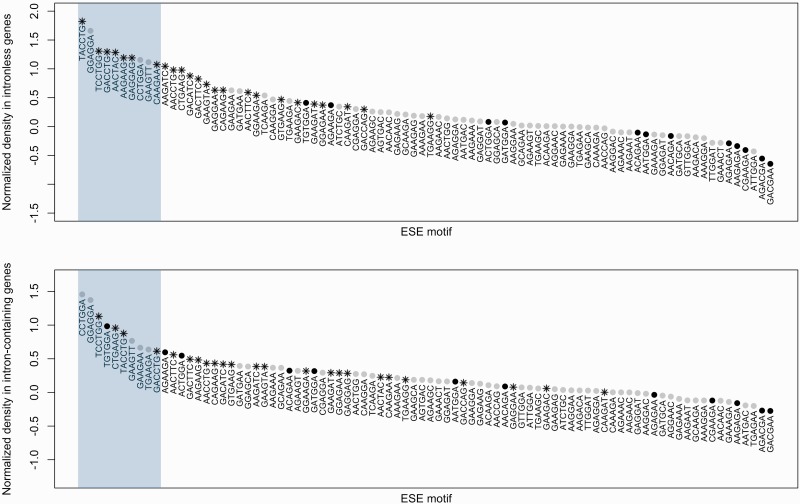
Fig. 7.
The top panel shows the ND of different ESEs in intronless genes. The blue rectangle highlights the ten most frequent motifs. The shape and color of the dot give information on the correlation between the ND of that motif and mean intron size bin indices. Grey circle: no significant correlation; black circle: significant positive correlation; black star: significant negative correlation. The bottom panel is identical, except that instead of the ND in intronless genes, it is the median ND across intron-containing bins that is plotted.

