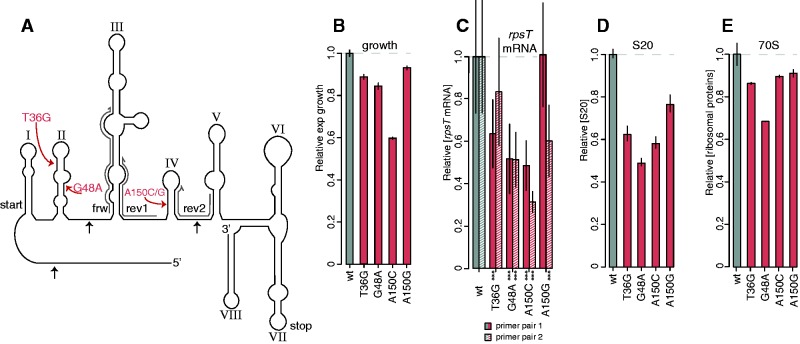
Fig. 1.
Four deleterious synonymous mutants in rpsT. (A) Structure of the rpsT P2 transcript (adapted from Mackie 1992). The structure of the E. coli rpsT mRNA was generated based on three methods of structural probing: Nuclease T1 and RNase CL3 cleavage pattern and dimethyl sulfate modification pattern (Mackie 1992). The four costly synonymous mutations are indicated in red. The roman numerals indicate the numbering of the stem-loops used throughout the text and black arrows indicate the three prominent RNase E cleavage sites in the E. coli rpsT transcript (Mackie 2013). The three primers used in the RT-qPCR are marked in grey (primer pair 1 = frw + rev1, primer pair 2 = frw + rev2). (B) Relative exponential growth rates of reconstructed synonymous mutants. Reported values represent the mean (±SD) of at least 12 independent experiments. The data for the growth measurements are listed in supplementyary table SI, Supplementary Material online. (C) Quantification of rpsT mRNA through RT-qPCR. Two primer pairs were used, as marked in (A) (supplementary table SII, Supplementary Material online). Filled bars represent primer pair 1, and striped bars primer pair 2. Reported values represent the mean (±SD) of at least ten replicates. *** indicate P < 0.001 (two-tailed Student’s t-test, equal variance) as calculated between mutant and wild-type. (D) Quantification of S20 through LC-MS/MS. Reported values represents the mean (±SD) of two independent experiments and is set relative to a wild-type control strain. (E) As in (D), but the average of all ribosomal proteins.

