Fig. 4.
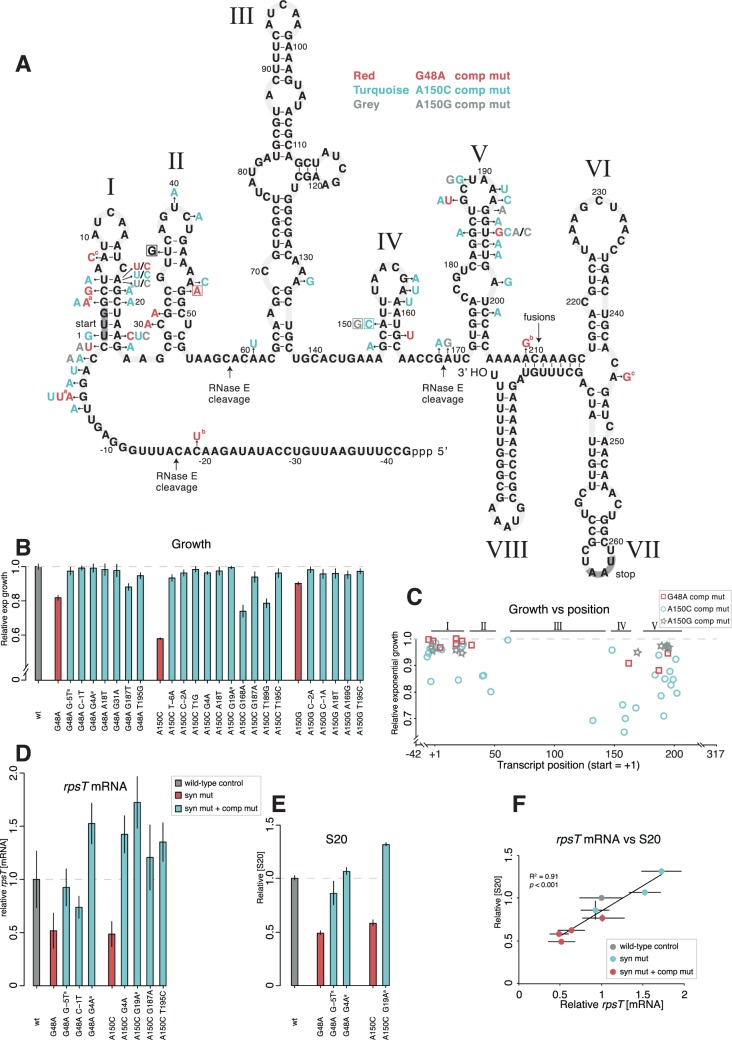
Intragenic rpsT suppressor mutations. (A) Predicted secondary structure of the S. enterica rpsT P2 transcript and intragenic mutations compensating the cost of the synonymous mutations. The figure is adapted from the structure of the E. coli rpsT transcript (fig. 1; Mackie 1992), but altered to show the S. enterica sequence. The locations corresponding to the three prominent RNase E cleavage sites in the E. coli structure (Mackie 2013) are indicated, as well as the site for translational fusions. Letters in boxes indicate the four synonymous mutations studied and letters without boxes indicate mutations that compensate for the cost of the synonymous mutations. The mutations are color coded so that mutations in red compensate for the G48A mutation, turquoise for the A150C mutation and grey for the A150G mutation. aMutants found in the evolution experiment. All other mutants were generated through random mutagenesis. bThe C-19U and the A209G mutations were found together in the same mutant, cas were the A8C and the A245G mutations. (B) Growth rates of reconstructed mutants. All values are set relative to an isogenic wild-type and represent the mean (±SD) of at least four independent experiments. The values are also listed in supplementary table SI, Supplementary Material online. (C) Scatter plot of growth rate measurements for the compensatory mutations found in (A) plotted against transcript position. +1 is the first base pair in the UUG start codon. In the cases where the mutant was not re-constructed, growth rate measurements from the original mutant were used (see supplementary table SI, Supplementary Material online). Roman numbers refers to the stem loops found in (A). (D) Quantification of rpsT mRNA through RT-qPCR of reconstructed mutants using primer pair 1 as indicated in fig. 1A. Reported values are set relative to an isogenic wild-type control and represent the mean (±SD) of at least five replicates. See supplementary fig. S7, Supplementary Material online for values measured with a different set of primers. (E) Quantification of S20 protein through LC-MS/MS. The values are the averages (±SD) of two biological replicates relative to a wild-type sample analyzed in the same 10-plex set. (F) Scatter plot of the data in (D) and (E). Data for the T36G and A140G mutants are also included.

