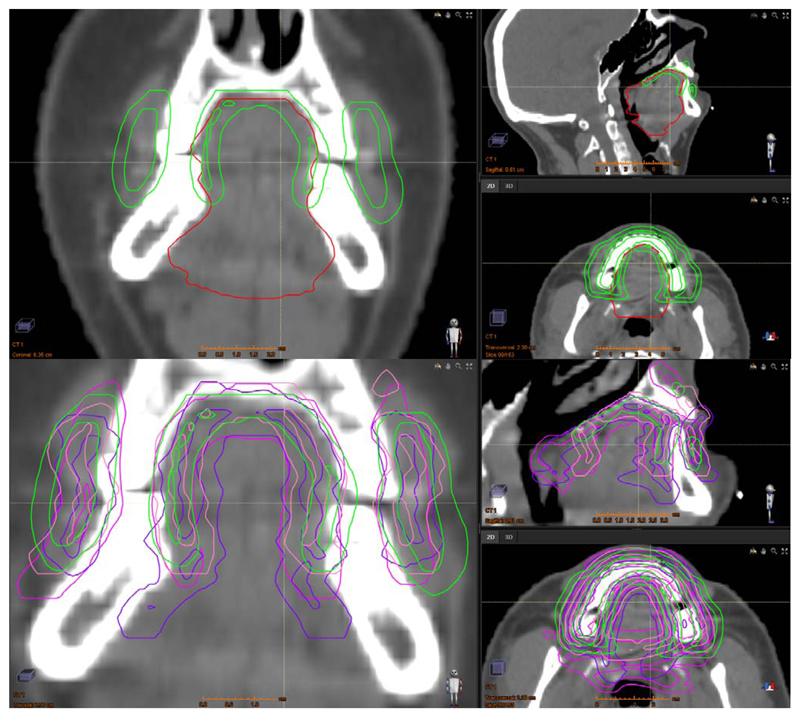
Figure 1.
Example (patient 4) of the fully automated ABS-generated MSC structure (top and bottom; green), the manually delineated OCC structure (top; red) and three different manually delineated MSC structures (bottom; pink, purple and coral). For each set of 3 images (top and bottom) the left, top right and bottom right images are coronal, sagittal and axial views, respectively.

