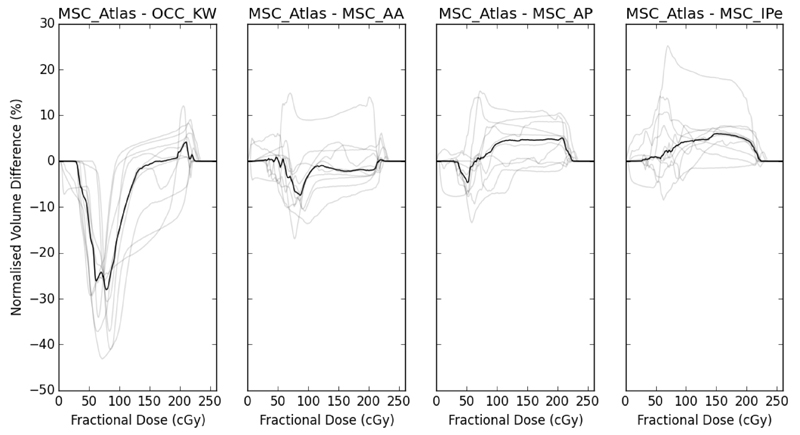
Figure 3.
Normalised volume differences, at each dose level, between atlas-based segmentation mucosal surface contours and oral cavity contours and each of the three sets of manually delineated mucosal surface contours. Black lines show medians and grey lines show the individual patients values. OCC_KW – oral cavity contours (by KW); MSC_AA – manual mucosal surface contours (by AA); MSC_AP – manual mucosal surface contours (by AP); MSC_IPe – manual mucosal surface contours (by IPe); MSC_Atlas – atlas-based segmentation mucosal surface contours.

