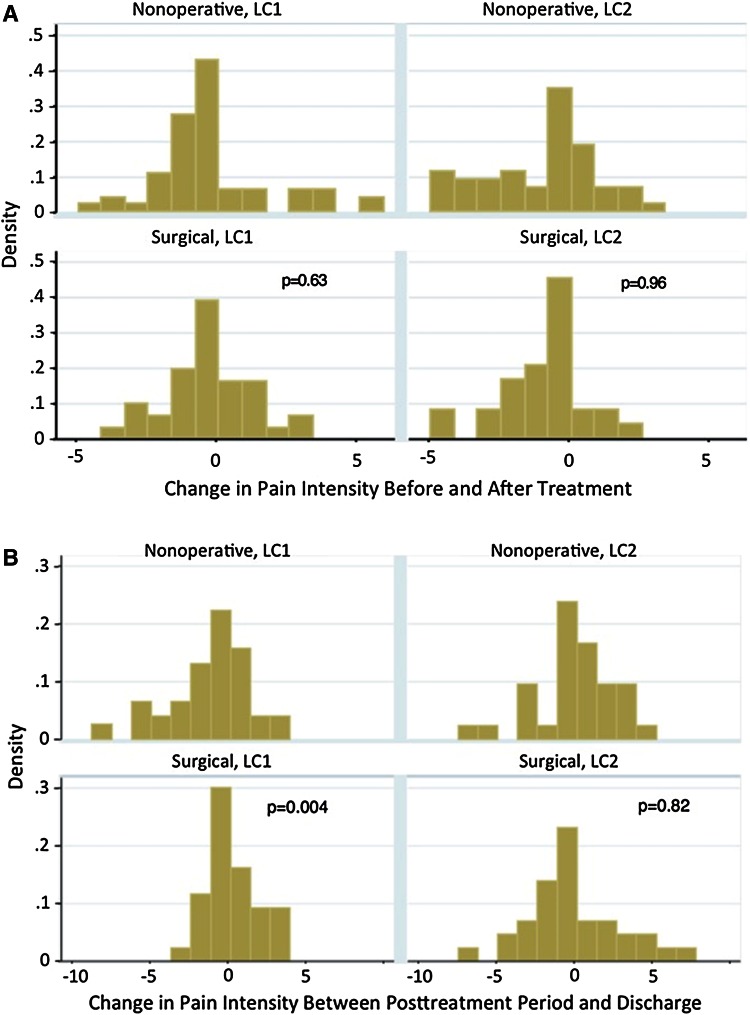
Fig. 2A–B.
(A) This graph demonstrates the change in pain intensity for the first 24 hours to 48 hours after treatment; the horizontal axis marks change in VAS score and the vertical axis is the percent distribution of the group. (B) This graph demonstrates the change in pain intensity between 48-hour mark and discharge.

