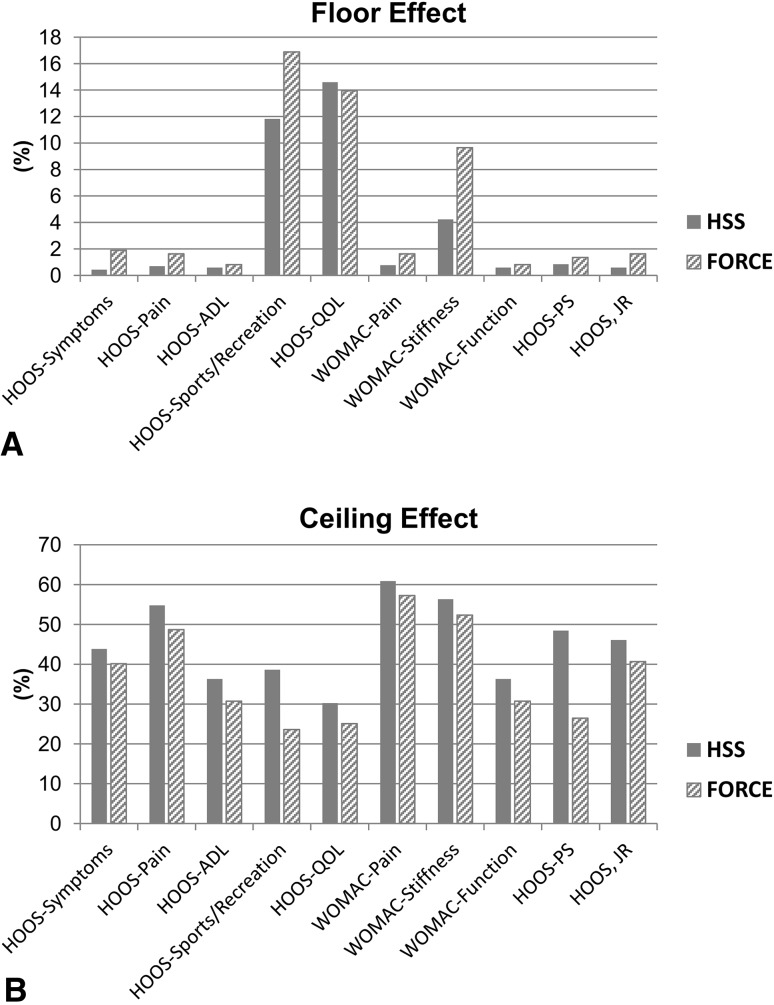
Fig. 3A–B.
This graph shows the (A) floor and (B) ceiling effects for 10 patient-reported outcome measures; HOOS-PS = HOOS Physical Function Short-Form; ADL = activities of daily living; QOL = quality of life; HSS = Hospital for Special Surgery; FORCE = Function and Outcomes Research for Comparative Effectiveness.

