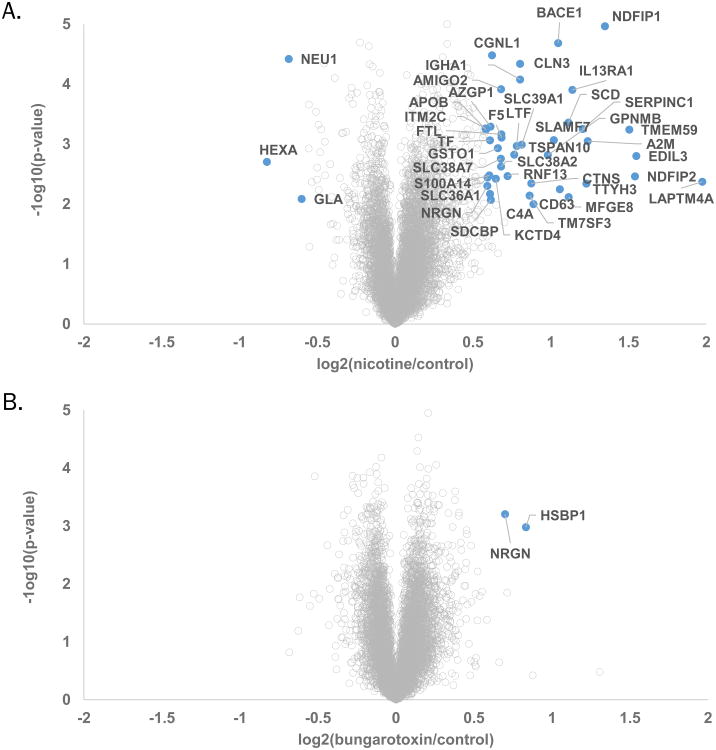
Figure 3. Volcano plots illustrate statistically significant protein abundance differences in cells treated with nicotine or α-bungarotoxin.
These volcano plots display the –log10 p-value versus the log2 of the relative protein abundance of A) average nicotine or B) average α-bungarotoxin to average control. Blue circles represent proteins with changes in abundance of greater than 1.5 fold and p-value >0.01.

