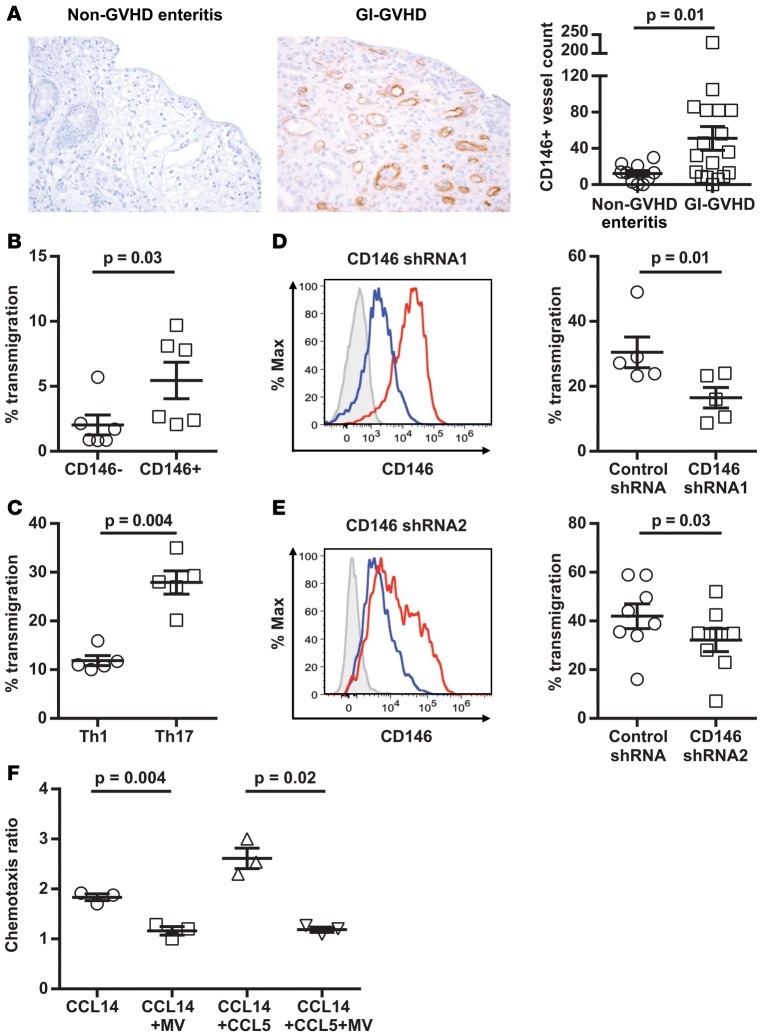
Figure 3. Endothelial CD146 expression in GI-GVHD colonic biopsies, transendothelial migration of CD4+ T cell subsets and with CD146 knockdown, and chemotaxis of CD4+CD146+CCR5+ T cells.
(A) Immunohistochemical analysis of CD146 expression in colonic biopsies taken at onset of symptoms from non-GVHD enteritis patients and GI-GVHD patients (magnification ×200). Dot plot showing mean ± SEM values for CD146+ vessel counts ×10, 2-tailed Student’s t test from non-GVHD enteritis patients (n = 10) and GI-GVHD patients (n = 18). (B–E) Transendothelial migration of CD146– and CD146+ T cells sorted from PB cells, Th1 and Th17 cells, Th17 cells with CD146 knockdown via CD146 shRNA1, or CD146 shRNA2. Representative flow cytometric histograms showing the efficiency of CD146 knockdown. Isotype control staining (gray) and CD146 staining of cells with the control shRNA (red) and CD146 shRNA (blue). Dot plots show mean ± SEM values for percentage of transmigrated CD4+ T cells (n = 6 for B, n = 5 for C, n = 5 for D, and n = 8 for E), 2-tailed Student’s t test. (F) CCR5-mediated chemotaxis of CD4+CD146+CCR5+ T cells toward CCL14 or CCL14 and CCL5. The sorted double-positive cells were pretreated with maraviroc (MV) or vehicle control. Data are presented as mean ± SEM values (n = 3), paired t test.

