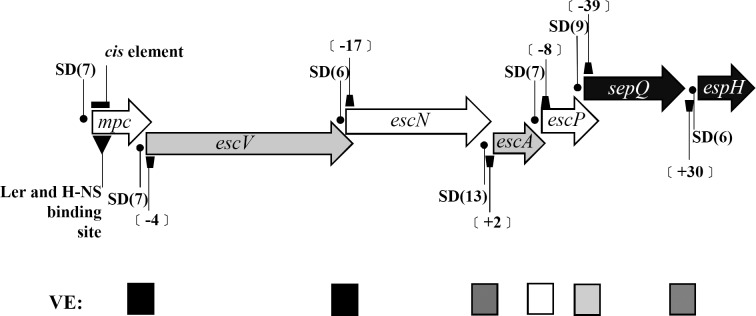
Fig 7. Diagram of the lee3 operon and the features found therein.
The seven genes that form the lee3 operon are painted differently according to their reading frames. The Shine-Dalgarno sequence (SD) of each gene is marked with a dot and the number in parenthesis following the SD indicates the distance (in nucleotides) between the last nucleotide of the SD sequence and the 1st nucleotide of the next cistron. Keystones represent the distance (in nucleotides) between two neighboring cistrons while negative values indicate an intergenic distance comprising overlapped nucleotides. The inverted and filled triangle below mpc marks one of the binding sites of Ler located within mpc [27]. The closed box above mpc indicates the position of nucleotides 1–100 of mpc that have a negative effect on the translation of downstream genes. The filled square marks points where a strong vicinity (polar) effect (VE) is observed with abortive translation of the preceding gene hindering the translation of the following gene, while the open square denotes no such effect being observed; finally, squares in different greyness represents intermediate vicinity effects being observed.

