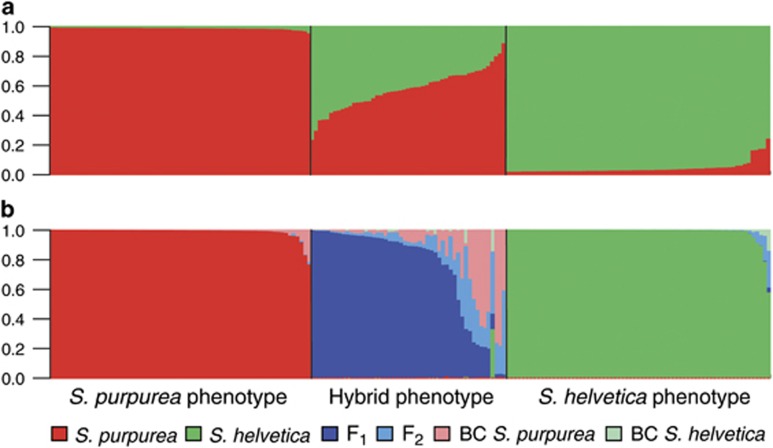
Figure 2.
Group assignment of the individuals sampled at the Rhône Glacier (N=188) in STRUCTURE (a) and NewHybrids (b). Each bar denotes one individual and the height of the color corresponds to the admixture proportion (qi) (a) or the posterior probability of the respective genotype frequency class (b). Individuals are sorted by descending q-values, so that the order is different in both charts.

