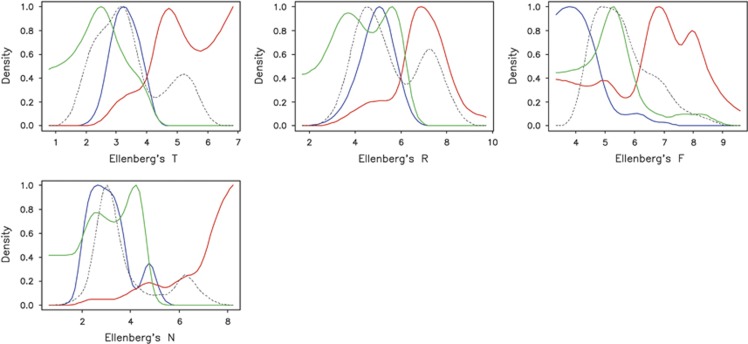
Figure 5.
Smoothed density of species abundances along four environmental gradients as calculated from 58 sampling plots taken at the Rhône Glacier forefield plus 92 additional samples (46 containing S. helvetica and 46 containing S. purpurea) randomly selected from the Austrian vegetation database. Ellenberg's T, R, F and N values are indicator values of temperature, pH, soil moisture and nutrient availability as computed from the accompanying vegetation. The green, red and blue curves represent densities of S. helvetica, S. purpurea and the hybrid (pooled), respectively. The dashed curve represents the density of the respective environmental variable.

