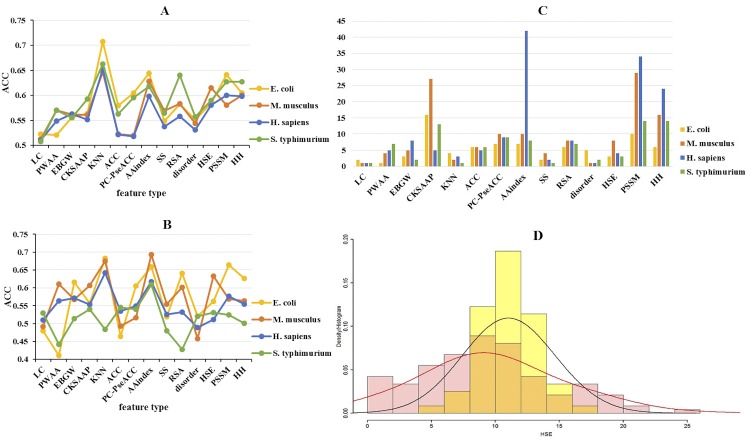
Fig 5. Predictive Capability of Different Types of Features on training dataset and independent test set.
(A) Predicted accuracy of the models based on different types of features on training dataset for four species. (B) Predicted accuracy of the models based on different types of features on independent test set for four species. (C) The number of different types of features in the final selected featues set for four species. (D) Histograms and fitted density curves of HSEBU values between acetylation sites and non-acetylation sites on H. sapiens structure dataset. The histogram of acetylation sites is colored by pink and density curve is colored by red while the histogram of non-acetylation sites is colored by yellow and density curve is colored by black.

