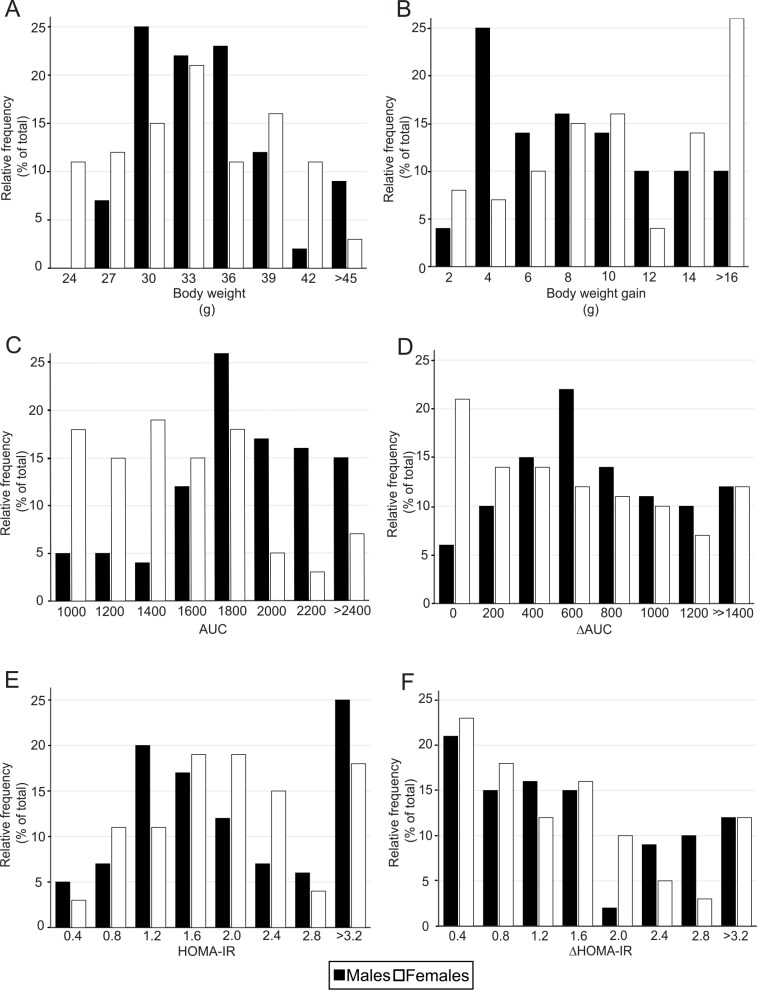
Fig 3. The distribution of selected obesity-associated phenotypes within the groups of HFD mice.
The following parameters including body weight at week 24 (A) as well as body weight gained between the week 12 and 24 of the experiment (B), glucose tolerance assessed as the area under the glucose curve (AUC) at week 22 (C) as well as its change (ΔAUC) between the week 12 and 22 (D), and insulin resistance assessed as HOMA-IR at week 22 (E) as well as its change (ΔHOMA-IR) between week 12 and 22 (F) were assessed and their intra-group distributions were plotted. Both male (black bars; n = 82) and female (white bars; n = 73) mice were analyzed.

