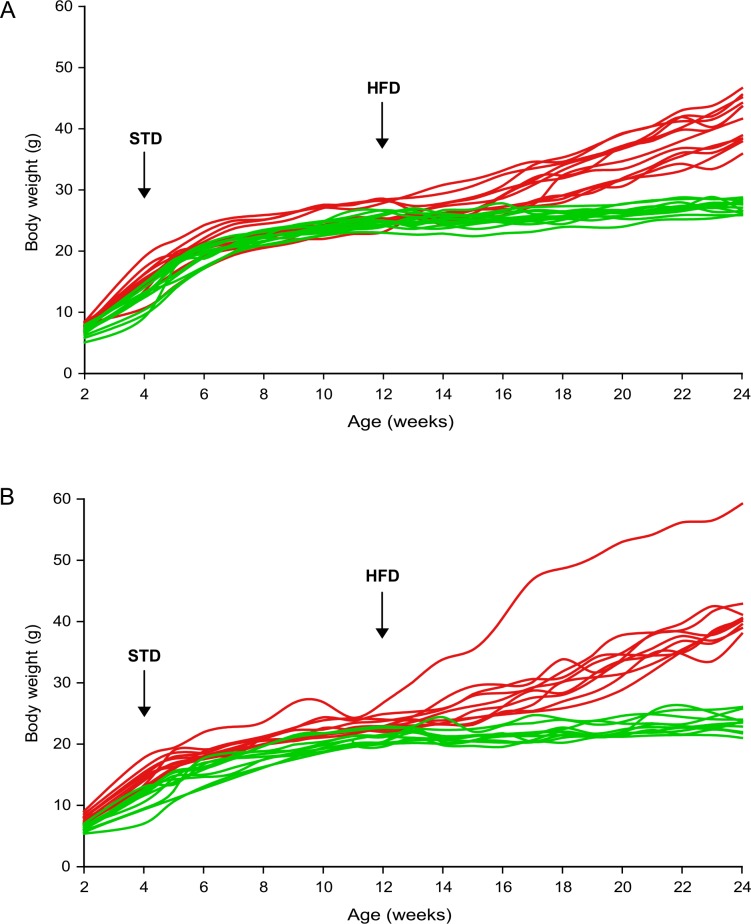
Fig 6. The course of changes in body weight in the selected groups of mice with the lowest and highest BWG.
The animals within the upper and lower 15% of the frequency distribution for BWG were selected and their respective body weights were plotted for both male (A) and female (B) mice. Mice with the lowest (green color) and highest (red color) body weight gain for both genders are shown.

