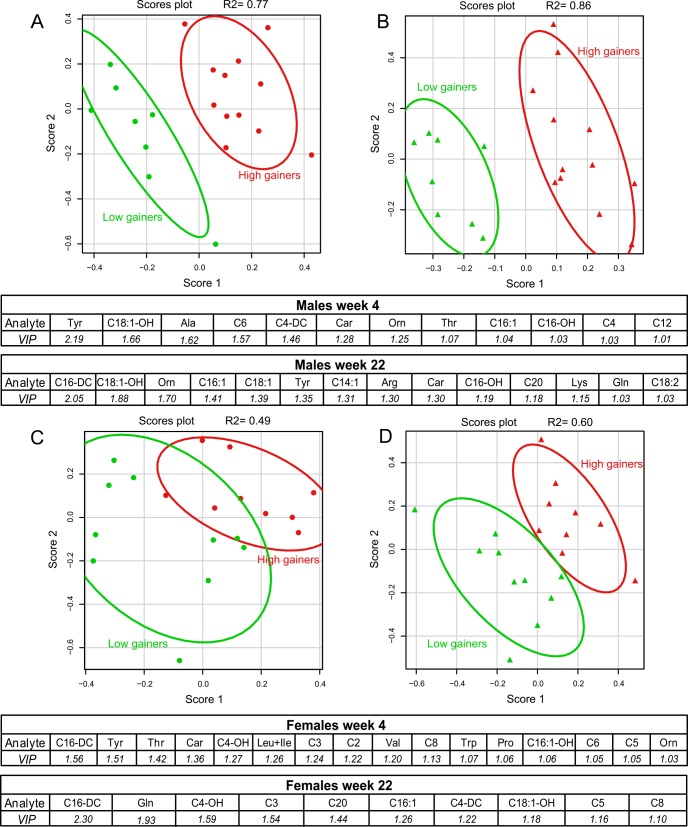
Fig 7. Multivariate analysis of plasma metabolome.
Plasma levels of AC species and amino acids in the fasting state were analyzed by the PLS-DA analysis in groups of mice selected for the highest and lowest BWG. Score plots resulting from the PLS-DA analysis of plasma metabolite levels measured at week 4 (A, C) and week 22 (B, D) of the study were generated for both male (A, B) and female (C, D) mice. Plasma metabolites that were identified as those most discriminating between the groups of „high gainers”(red marks) vs. „low gainers”(green marks) in both genders are listed in the tables under the respective score plots; the metabolites are ranked according to their variable influence on projection (VIP) scores, and only those with VIP scores greater than 1 are shown. Three outliers based on PCA analysis and two animals due to missing values were excluded from further analysis.

