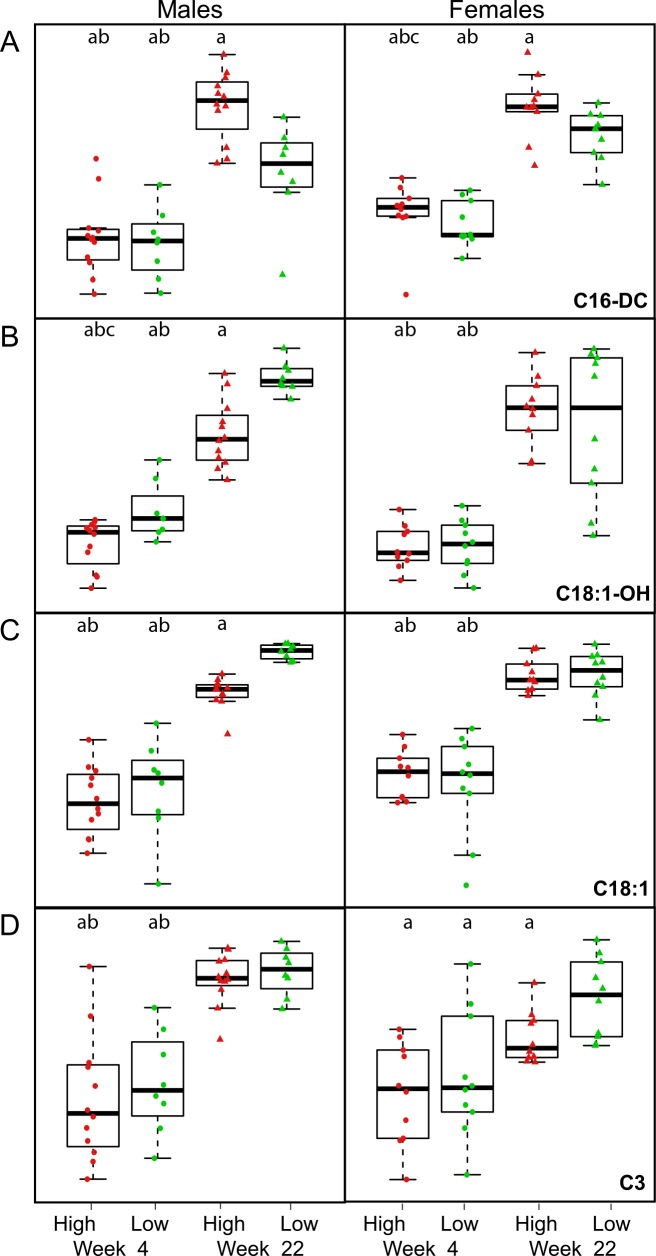
Fig 8. Plasma levels of selected metabolites showing a significant difference between the groups of mice with the lowest and highest BWG.
Plasma levels of C16-DC (A), C18:1-OH (B), C18:1 (C), and C3 (D) were assessed at week 4 and week 22 (i.e. after 10 weeks of high-fat feeding) in groups of male and female mice showing the lowest (green marks) and highest (red marks) BWG. ap<0.05 vs. „low gainers”at week 22; bp<0.05 vs. „high gainers”at week 22; cp<0.05 vs. „low gainers”at week 4.

