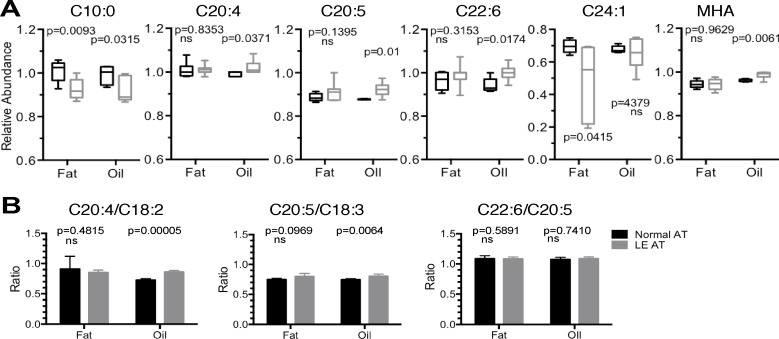
Fig 4. AT Fatty Acids.
(A) Box and whisker plots of relative abundance (median-normalised log transformed data) of individual fatty acid species found to be statistically significantly altered and > ± 0.1-fold altered in LE patient AT fat or fat oil (grey) compared to normal AT fat or fat oil (black) (Lipid species referred to with Cx:y namenclature to define the total number of carbons in the fatty acid chain and double bonds). (B) Ratio of C20:4 arachidonic acid and C20:5 eicosapentaenoic acid relative to their precursors, C18:2 and C18:3 linolenic acids, respectively. Statistical significance as noted, determined by two-tailed students t-test with p < 0.05 not assuming equal variance, or no significant difference (ns) detected.

