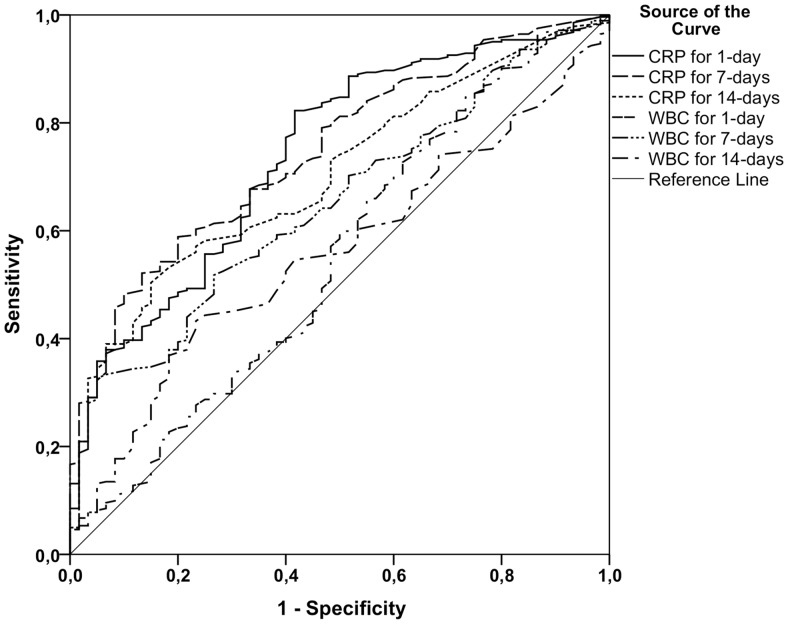
Fig 3. Receiver-operating characteristic (ROC) curve analyses of C-reactive protein (CRP) concentrations and white blood cell counts (WBC) with respect to presence of any deep infection focus recorded during 30-days.
The area under the curve (AUC) for the day of the positive blood culture, CRP was 0.074 (95% CI, 0.67–0.81; p<0.0001) with a cut-off value of 108 mg/L with sensitivity of 77% and specificity of 60%. For CRP on day 7, the AUC was 0.75 (95% CI, 0.68–0.81; p<0.0001) with a cut-off value of 44 mg/L with sensitivity of 68% and specificity of 67% and for CRP on day 14 the AUC was 0.70 (95% CI, 0.64–0.77; p<0.0001) with a cut-off value of 22 mg/L with sensitivity of 59% and specificity of 68%. The corresponding AUC for WBC on the day 1 was 0.55 (95% CI, 0.46–0.63; p = 0.236) and a cut-off value was not determined. For WBC on day 7 the AUC was 0.65 (95% CI, 0.58–0.72; p<0.0001) with a cut-off value of 8.5 x10⁹/L with sensitivity of 59% and specificity of 62%. For WBC on 14 days, the AUC was 0.56 (95% CI, 0.49–0.63; p = 0.153) with a cut-off value of 7.25 x10⁹/L with sensitivity of 44% and specificity of 75%.

