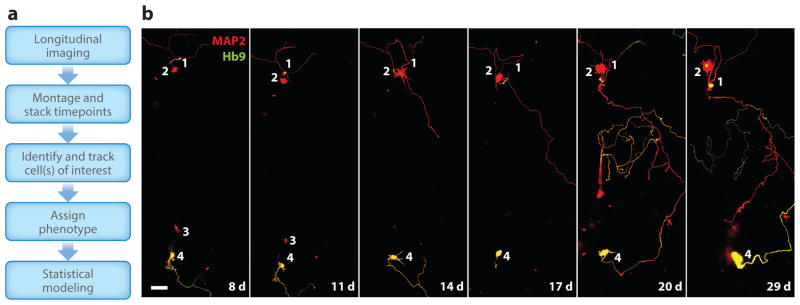
Figure 2.
Acquisition, analysis, and modeling in robotic microscopy (RM). (a) Typical flow of data capture, organization, analysis, binning by phenotype, and statistical modeling with RM. (b) Longitudinal imaging of a control induced pluripotent stem cell (iPSC)-derived motor neuron differentiation 8–29 days (d) posttransfection with the neuronal marker MAP2 (red) and the motor neuron–specific marker Hb9 (green). Note that cell 2 is positive only for MAP2, and cell 4 is positive for both MAP2 and Hb9. Also note that cell 3 is no longer in the analysis after day 11. Scale bar indicates 25 μm.

