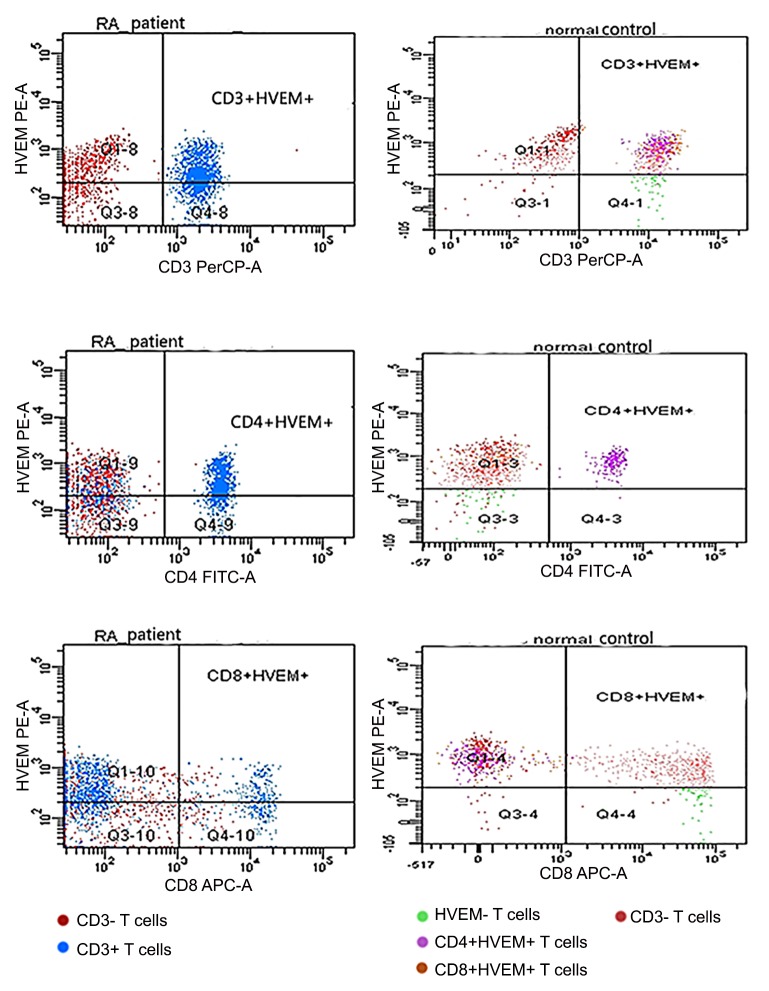
Fig 3. Expression of HVEM on peripheral T cells.
T cells of RA patients and healthy controls ran in different times, so the same color might stand for different subtypes of T cells. Dots above to the horizontal line stood for HVEM+ T cells, inferior to the horizontal line stood for HVEM- T cells, right to the vertical line stood for CD3+, CD4+ or CD8+ T cells and left to the vertical line stood for CD3-, CD4- or CD8- T cells.

