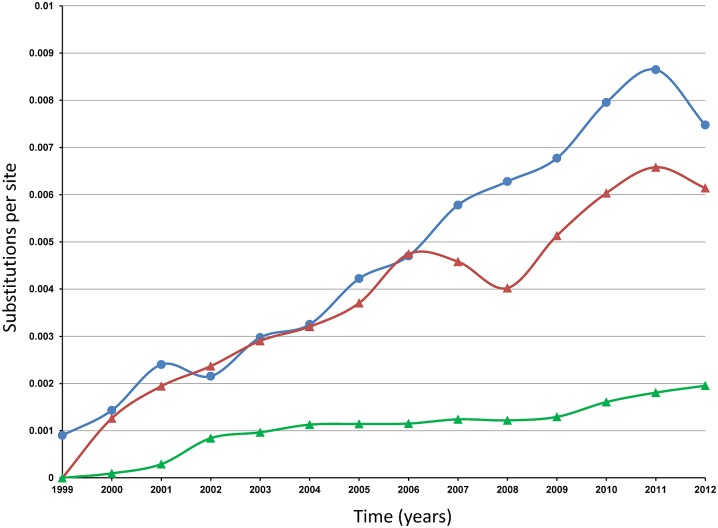
Fig 1. Increasing evolutionary divergence of North American WNV strains over the time of collection.
Y-axis: Substitutions per site. X-axis: Years. Blue line: average divergence over sequence pairs within years; the numbers of base substitutions per site from averaging over all sequence pairs within each year are shown. Red line: divergence over sequence pairs between 1999 and other years; the numbers of base substitutions per site from averaging over all sequence pairs between 1999 and other years are shown. Green line: estimates of net evolutionary divergence between groups of sequences, 1999–2012: the numbers of base substitutions per site from estimation of net average between groups of sequences corresponding to each year are shown. Analyses were conducted in MEGA6 [24] using the Maximum Composite Likelihood model [46].

