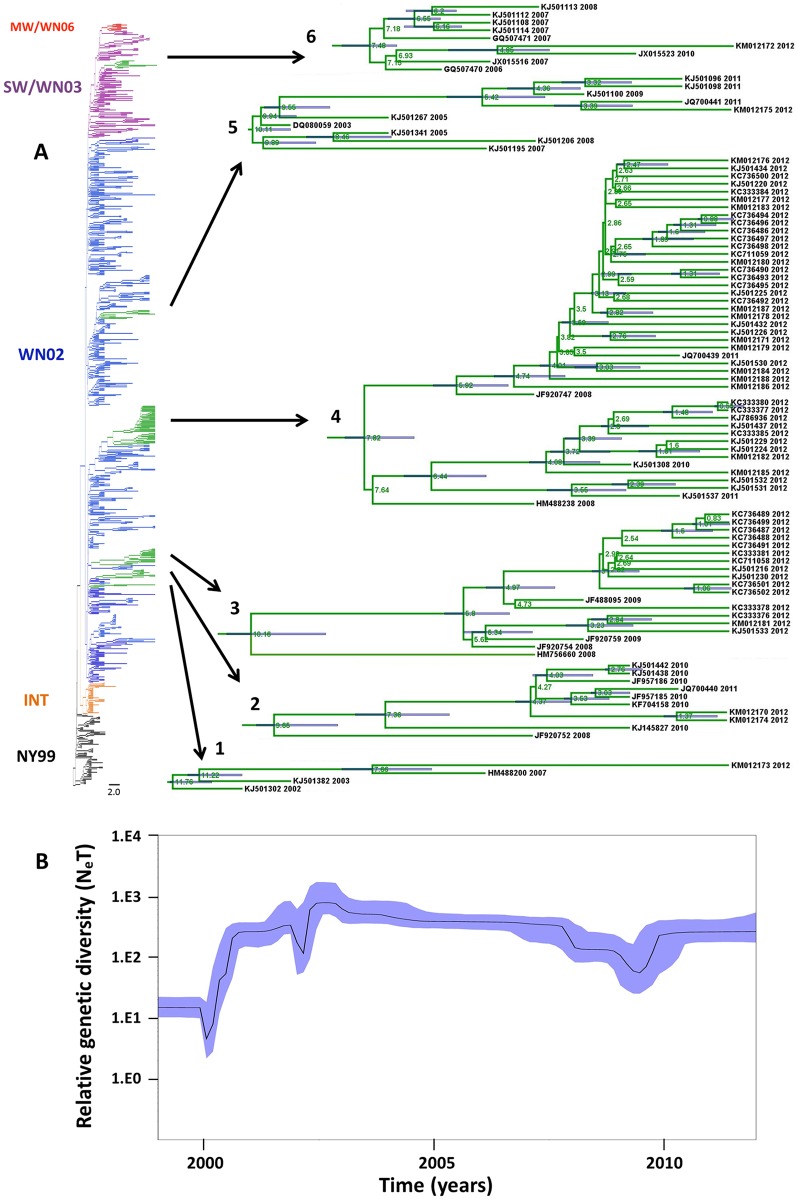
Fig 4. Maximum clade credibility tree from Bayesian analysis of WNV strains from North America, 1999–2012 (n = 870).
A) WNV genotypes are color-coded in the branches of the tree as NY99 (black), WN02 (blue), SW/WN03 (purple) and cluster MW/WN06 (red). Nodes 1 to 6 containing WNV isolates from this study are highlighted in green and shown in detail. The mean time to the most recent common ancestor (tMRCA) is shown in each principal node. The 95% highest probability densities (95% HPD) for each node age are shown as blue bars. B) Bayesian coalescent inference of genetic diversity and population dynamics using the Bayesian Skyline plot. The X axis represents years of study and the Y axis, the relative genetic diversity product of the effective population size.

