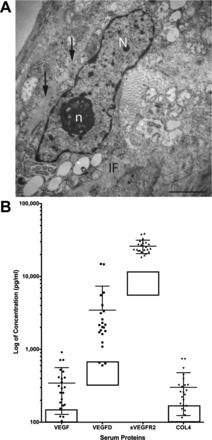
Fig. 5.

Image of a renal angiomyolipoma cell with basal lamina and serum biomarkers in patients with TSC and renal angiomyolipomas. A: scanning electron microscopy image of an angiomyolipoma cell from a patient with TSC. Note the basal lamina (black arrows). N, nucleus; n, nucleolus; IF, intermediate filaments. Bar = 2 μm. B: serum biomarkers from patients with TSC. Solid circles are individual patients (n = 25), and boxes represent the normal range in unaffected individuals. sVEGFR, soluble VEGF receptor (VEGFR); COL4, collagen type IV.
