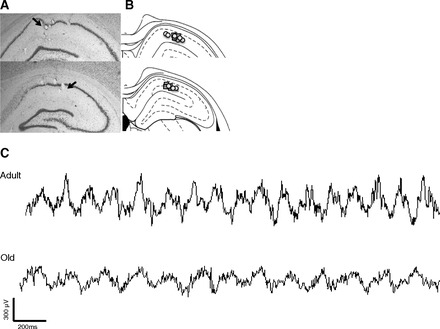
Fig. 2.

Depiction of electrode placements. A: photomicrographs of electrode locations. For power and theta gamma coupling measures a single electrode was chosen from each rat from the stratum radiatum layer (arrow). B: electrode locations of all rats; placements in young rats are represented by squares and placements in old rats by circles. C: examples of unfiltered traces during maze running show prominent theta activity in both young and old rats. Note the slower frequency in the trace from the old rat and the difference in differences in gamma amplitude across the theta cycle in young adult and old rats.
