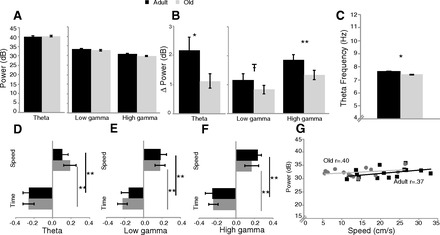
Fig. 3.

Baseline measures during exploration of a highly familiar environment (maze 1 epoch). A: the amplitude (power) of theta, low gamma, and high gamma did not differ between age groups. B: change in power as animals transitioned from sitting to running; power increased more in the adult rats during running. C: theta frequency was lower in old rats. D–F: regression analysis of the contribution of running speed and time on the maze. β-Values are greater for time for theta power (D), low gamma power (E), and high gamma power (F). G: example of the correlation between running speed and theta power. Old rats had a lower running speed but similar correlations with theta power as adult rats. *P < 0.05, **P < 0.01; т-0.05 < P < 0.1.
