Fig. 5.

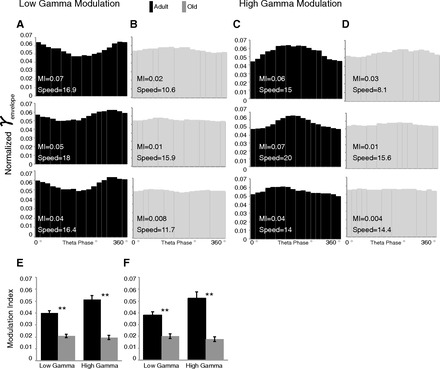
Theta phase modulation of gamma envelope. A and B: distributions of theta phase modulation of the low gamma amplitude envelope in young (A) and old (B) rats representing the highest, median, and lowest modulation values (modulation index) and corresponding running speed (cm/s) for each age group. C and D: distributions of theta phase modulation of high gamma amplitude envelope in young (C) and old (D) rats representing the highest, median, and lowest modulation values for each age group. E: mean (±SE) modulation values of low and high gamma during maze 1; young rats had higher modulation of both low and high gamma. F: low and high gamma during maze 1 segments matched for speed for adult and aged rats. **P < 0.001.
